Your Bag Is Empty
Explore timeless jewelry that carries love and inspires lasting change
Every purchase gives one person access to clean, life-changing water.
Explore timeless jewelry that carries love and inspires lasting change
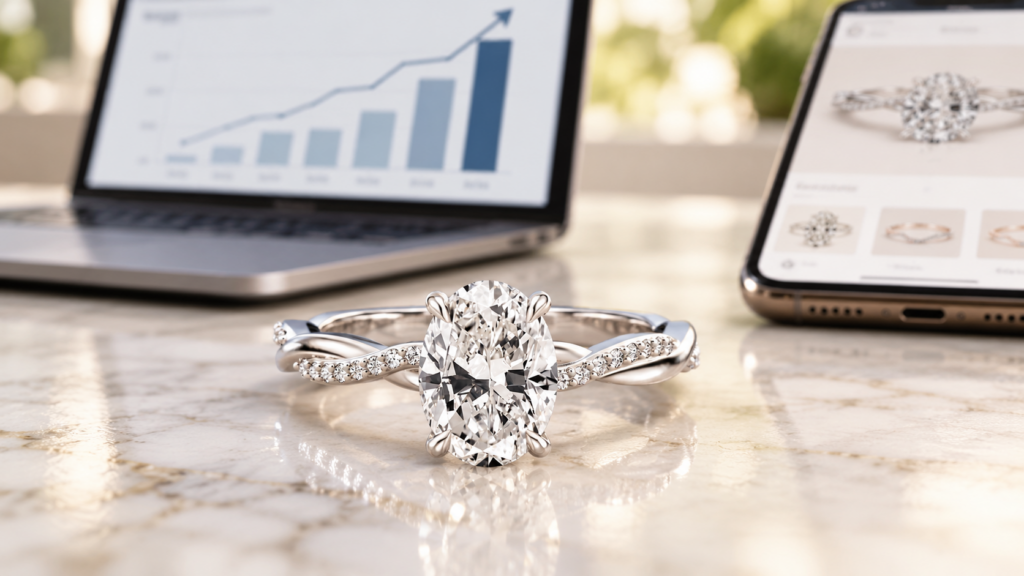
The latest engagement ring statistics show how cost, size, and shopping habits are changing. Couples are weighing cost carefully, choosing larger center stones, and treating the purchase as a shared decision. Full-year 2025 data puts the median sales price at $6,939. Survey data places average spend at $4,600. Lab-grown center stones now make up a majority of reported purchases in one major survey. [1] [2]
This page brings together 51 verified data points from appraisal records, a national couple survey, a purchaser and recipient study, and GIA. Full-year 2025 findings are kept separate from January through June 2026 figures, so partial-year data is never mistaken for a completed annual result.
These headline numbers use different measures, so read the label as carefully as the number. A median sales price, an average survey response, and an appraised replacement value answer different questions.
Cost benchmarks can look contradictory until you separate the datasets.
BriteCo reports medians tied to appraisals and recorded sales. The Knot reports averages from couples married in 2025. A median marks the middle value. An average adds all reported amounts and divides by the number of responses.
BriteCo’s 2025 median appraised replacement value was $9,676. That figure estimates retail replacement cost for insurance and is not the original purchase price, resale value, or cash value. [1]
Couples married in 2025 told The Knot they spent an average of $4,600 on the engagement ring. This is a survey average, not a recommended budget. [2]
The useful takeaway is simple. Compare like with like, then choose a number your finances can carry comfortably. Do Amore’s guide to setting a comfortable engagement-ring budget explains how to factor in cash flow, debt, savings, tax, insurance, and financing without relying on a salary rule.
Those figures describe market behavior, not quality rankings or a reason to favor one origin. Price per carat cannot tell you how well a diamond is cut, how it faces up, or which grading details matter most to you.
Compare engagement ring prices only after the diamond details match, because equal carat weights do not make two stones equal. Check the grading report number, cut, color, clarity, measurements, and proportions before deciding that one listing costs less.
Do Amore’s price match applies to the same exact diamond at a live advertised price. That standard protects you from comparing a lower price on a different stone and mistaking it for equal value. Send the team a live link so they can verify that the lower price applies to the same exact diamond before confirming a match.
Center stones have become heavier in recent appraisal data, but weight alone cannot tell you how large a diamond will look on the hand. Dataset definitions matter here too. BriteCo reports medians from appraisal-linked records. The Knot reports averages from surveyed couples.
GIA defines one metric carat as 200 milligrams. Carat measures weight rather than the visible width or length of a diamond. [4]
Two diamonds with similar weights can face up differently because of shape, proportions, and how the cutter distributed the weight. A deeper stone can hide more weight below the girdle. If the look on the hand matters most, compare carat weight with visible size and review the stone’s dimensions alongside its cut details.
Lab-grown adoption rose quickly, but the exact share changes with the population being measured.
Appraisal records show what was newly appraised. Couple surveys reflect what respondents said they bought. Both help, as long as you keep each sample attached to its number.
Lab-grown diamonds are now a mainstream choice. That shift leaves room for both origins, and the right fit still comes down to your priorities. Do Amore offers both lab-grown and natural diamonds, and its guide to understanding lab-grown diamonds can help you compare origin, grading, appearance, and budget without pressure.
Popularity is a useful place to start, but it cannot choose for you. Look at how the individual diamond sits on the hand, how its proportions feel, and how securely you want it set. The shares are inspiration, not instructions.
Round still led, but oval’s share shows how firmly an elongated silhouette has entered the mainstream. Do Amore’s guide lets you compare diamond shapes by sparkle pattern, face-up look, setting fit, and personal style.
Shape describes the outline of the center stone. Setting describes how the stone is held and how the rest of the ring is designed. BriteCo groups these style labels from appraisal records, so the categories reflect that dataset rather than every jeweler’s naming system.
A popular style can still feel personal when the proportions, metal, band, and center stone suit the wearer. If you are ready to move from broad trends to a one-of-a-kind design, you can explore custom engagement ring designs without treating popularity as a rule.
BriteCo’s metal shares come from appraisal records, so they describe that sample rather than every jeweler’s catalog. Do Amore’s engagement rings are made with recycled precious metals.
Yellow and white gold were close. Platinum held a meaningful share, and rose gold remained more niche. Color is only one part of the choice. Think about wear, maintenance, budget, and how the metal frames the center stone.
Ring shopping often starts months before the final purchase, and plenty of couples make the decision together. That can take some pressure off the proposal. You can keep the moment itself meaningful while still inviting the recipient into the choices that affect style, comfort, and budget.
Keep the proposal personal by separating shared ring decisions from the timing and details of the proposal. Agree on the budget, stone, setting, and nonnegotiables together, then leave room for one person to choose the final combination or plan the moment.
Do Amore’s one-on-one buying support lets you get answers privately or together by chat, text, phone, email, or video. That can lower the risk of guessing wrong without giving away the date, location, or words you plan to use.
Proposal activity remains seasonal even as ring selection becomes more collaborative. Planning early gives you room for research, production, shipping, and any final adjustments without tying the decision to a rushed deadline.
Jewelers Mutual’s study was fielded in August 2024 among more than 1,500 U.S. adults who had bought or received an engagement ring during the previous five years. Its population differs from The Knot’s newlywed sample, which is why the percentages should sit beside each other rather than be blended. [3]
Start with the trade-offs you can live with. Set a comfortable total budget, compare grading details on a like-for-like basis, and look at visible dimensions next to carat weight. Averages can tell you what a market did. They cannot decide what you should spend or wear.
Origin deserves the same calm treatment. Lab-grown and responsibly sourced natural diamonds can both be beautiful, meaningful choices. Ask for the grading report, compare the individual stones, and choose the combination of appearance, origin, and price that feels right to you.
Do Amore makes that comparison with both lab-grown and responsibly sourced natural options, along with recycled precious-metal settings. The brand’s clean-water impact connects every purchase with lasting access to clean water for one person, and the founder story explains how experience drilling for oil became a way to help fund wells. Let those values add meaning after the practical decision already feels sound.
A useful engagement ring statistic needs three labels nearby. You should be able to see who was measured, when the data was collected, and what the number actually represents. Without those labels, a precise figure can still give you the wrong impression.
That is why this page does not collapse appraisal records and survey responses into one master average. Appraisal-linked data is strong for tracking the characteristics and declared values of rings that enter that system.
A couple survey is better at describing reported spending, shopping behavior, and how the proposal unfolded. Each has blind spots, and neither stands in for every U.S. engagement ring purchase.
Dates can trip you up too. A report published in 2026 may describe rings bought in 2025. A live report may include a first-half 2026 snapshot that changes as the year continues. Keeping the data year beside the figure protects you from reading a publication date as the measurement period.
Sample definitions deserve attention too. Newly married couples, people who bought or received a ring within the past several years, and appraisal customers are different populations. If their answers diverge, the first question should be whether they measured the same thing. Often, they did not.
An average is easy to recognize, but it can be pulled upward by a smaller number of expensive purchases. A median identifies the middle of an ordered dataset, so half of the values sit above it and half below. Each measure describes the group differently, and either one can be useful with the right context.
For a shopper, the safest use of either number is to establish context. It can help you recognize the broad market range and ask sharper questions. It cannot tell you what your ring should cost, because it knows nothing about your monthly obligations, savings, preferred stone, design, or the person who will wear it.
Replacement value needs its own lane. An appraised replacement value estimates what it may cost to replace a ring at retail for insurance purposes. It is not proof that the ring could be resold for that amount, and it should not be compared directly with a survey answer about what someone paid. Keeping those measures separate makes the cost data far more useful.
Once the numbers have given you context, come back to your own ceiling. A comfortable budget leaves room for the rest of your life. The ring should carry meaning without turning the next statement or savings goal into a source of stress.
Market statistics can show that larger center stones and lab-grown diamonds have become more common. They still cannot evaluate the individual diamond in front of you. Two stones with the same origin and weight may differ in cut, color, clarity, proportions, fluorescence, measurements, treatments, and overall appearance.
Start with the grading report and make sure the identity details line up. Then compare visible dimensions and how the stone returns light.
A heavier stone can carry weight where you do not see it. A well-proportioned stone at a slightly lower weight may look just as large from the top. The number on the scale is part of the decision, not the whole decision.
Price-per-carat figures need care.
They are useful for observing broad market movement, but a shopper cannot apply one category-wide rate to every diamond. Shape, size band, quality grades, and supply all change the price. A fair comparison matches the important grading details before it compares totals.
Diamond origin deserves that same care. A national share tells you how common lab-grown or natural choices were in a sample. It does not settle your priorities. Some shoppers focus on budget and visual size.
Others care most about geological origin, rarity, or a specific sourcing story. The right comparison gives both options the same honest examination.
Shape, setting, and metal rankings are snapshots of collective preference. They can reveal what you are likely to see while shopping, but they should not flatten every ring into the current favorite. A ring will be worn long after a trend chart changes.
Look at shape first as a visual language. Round, oval, emerald, cushion, radiant, and pear silhouettes handle light and finger coverage differently. Then look at the individual stone. Proportions within the same shape can change whether it appears broad, narrow, soft, crisp, deep, or shallow.
Setting data needs the same translation. A solitaire may appeal because it keeps attention on the center stone. A halo can change the overall outline. A three-stone design carries a different balance and symbolism.
Security, height, daily routine, and the wedding band you may pair with it all matter more than rank.
Metal share is not a durability score. Color preference, alloy, maintenance, and how the setting frames the stone should guide the choice. Trend data can open a useful shortlist. The final decision should come from trying the combinations together and noticing what keeps drawing your eye.
Shopping and proposal timelines often overlap, but they follow different clocks. People often start learning early, then make the final selection closer to the proposal. That gap is useful.
It gives you time to understand the terminology before a deadline turns every decision into a trade-off made under pressure.
Build the schedule backward from the proposal only after you understand what the ring requires. A ready-made setting, a made-to-order design, and a fully custom piece can have different production needs.
Shipping, sizing, and final review deserve room. If timing is tight, ask what can be confirmed before placing the order rather than assuming every ring follows the same calendar.
Choosing together can still leave plenty of room for surprise. You can ask directly, gather a shortlist together, or invite input on the details that are hardest to guess while keeping the final choice and moment private. The statistics show that recipient involvement is common. The form it takes can still feel entirely your own.
A little breathing room leads to better questions. You can focus on the diamond, setting, documentation, budget, and fit instead of racing a date. That is the real value of the data. It helps you plan with clearer expectations while leaving the emotional part of the decision where it belongs, with the two of you.
These answers keep the data year and method attached to each benchmark, so you can compare the figures without treating partial-year data as final.
A completed 2026 national average is not available from the sources used here. The latest full-year benchmarks are BriteCo’s 2025 median sales price of $6,939 and The Knot’s average spend of $4,600 among couples married in 2025. [1] [2]
BriteCo reports a January through June 2026 median sales price of $6,736, but that is partial-year appraisal-linked data rather than a full-year average. [1] Treat every benchmark as context, not a spending rule.
BriteCo’s full-year 2025 median center stone was 2.0 carats. The Knot reported a 1.9-carat average among couples married in 2025. [1] [2]
The difference reflects median versus average and appraisal records versus survey responses. Carat measures weight, so check face-up dimensions and cut before deciding how large a stone looks.
Lab-grown diamonds made up 47.0% of BriteCo’s new 2025 engagement-ring appraisals and 61% of purchases reported in The Knot’s study of couples married in 2025. [1] [2]
BriteCo’s 51.0% figure covers January through June 2026 only. [1] These are different samples, but both show that lab-grown center stones have moved into the mainstream.
Round led BriteCo’s full-year 2025 appraisal data at 35.2%, followed by oval at 22.0%. [1]
Popularity is useful for inspiration, but the best shape is personal. Compare the individual stone’s proportions, sparkle pattern, setting, and look on the hand.
Engagement ring statistics can make an unfamiliar purchase feel less intimidating, but they cannot choose the stone, setting, or story that feels right to you. Use the numbers to set guardrails, then let your budget, preferred look, and shared priorities make the final call.
If you want a calm second opinion, Do Amore can walk through the grading details and design trade-offs with you. Every purchase gives one person access to clean water, so the ring can carry meaning beyond the proposal. Compare ring options or ask the team for guidance when you feel ready.