Your Bag Is Empty
Explore timeless jewelry that carries love and inspires lasting change
Every purchase gives one person access to clean, life-changing water.
Explore timeless jewelry that carries love and inspires lasting change
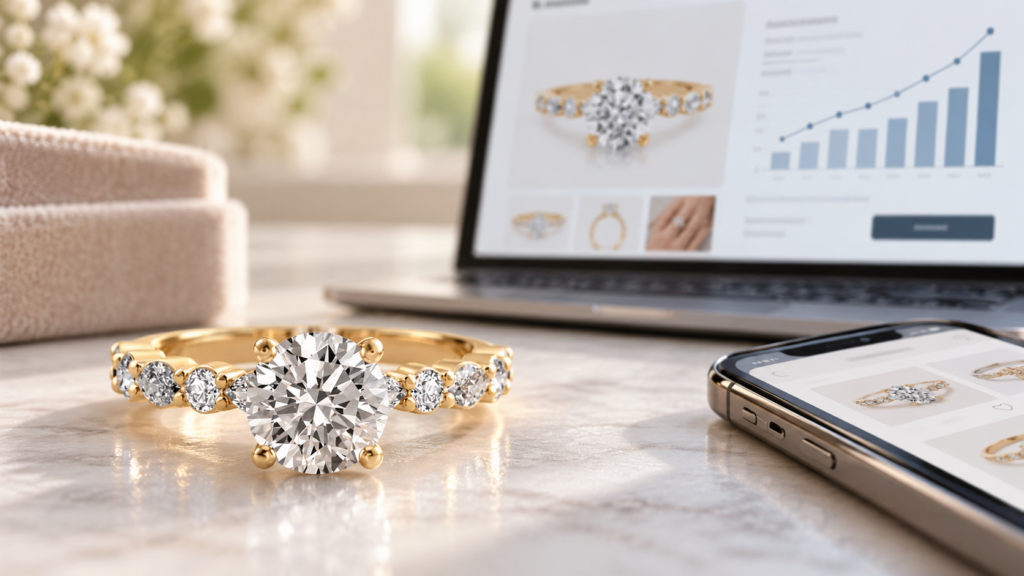
Comparing online jewelry sales statistics is harder than it first appears. One source may estimate global jewelry revenue, another may survey qualified U.S. buyers, and others may track all ecommerce or personal luxury goods across very different periods. Every figure can help, but only when its year, geography, population, unit, and method travel with it. A precise number can still answer the wrong question when revenue, buyer incidence, channel forecasts, and completed sales are treated as if they measure the same thing.
This guide keeps those boundaries visible from the start. Jewelry-only estimates stay separate from general retail, luxury, and single-platform results. Calculations and forecasts carry clear labels beside them. Think of an estimate as a modeled value for a stated period, a forecast as a future projection built on assumptions, a survey as answers from a defined sample, and a calculation as a visible formula applied to published inputs. That precision may feel fussy, but it prevents a common mistake on statistics pages and keeps a figure published in 2026 from being mistaken for sales that occurred in 2026.
These figures sit together to frame jewelry ecommerce statistics, but they do not speak the same language. The first three are jewelry-only modeled figures. The survey measures reported behavior in a qualified U.S. sample. Census and Adobe cover general U.S. ecommerce. Bain and The RealReal add broader luxury context, so their scale only makes sense when those definitions remain attached.
There is no single observed sales total that covers every online jewelry category and country. The clearest jewelry-only calculation in the available evidence comes from one global market model, and it applies to 2025 rather than 2026.
Grand View Research valued the global jewelry market at USD 381.5 billion in 2025. Its distribution model assigned 83.9% of revenue to offline retail stores. [1]
Subtracting that offline share from 100% produces a calculated online share of 16.1%. Multiplying USD 381.5 billion by 16.1% produces approximately USD 61.4 billion in modeled 2025 online jewelry revenue after rounding. [1]
Both figures are author calculations built from one provider’s published inputs. Another research firm could draw the category or channel boundaries differently, and neither figure represents a census of retailer receipts.
The model’s visible segmentation covers rings, necklaces, earrings, and bracelets, along with several materials, end-user groups, regions, and online or offline distribution. That breadth makes it useful for estimating online jewelry market size. The result is not limited to fine jewelry, engagement rings, U.S. shoppers, or one retailer’s sales.
Grand View Research estimates the total global jewelry market at USD 397.7 billion in 2026. [1] That amount includes online and offline distribution.
Applying the 2025 online share to the 2026 total would assume the channel mix did not change. The source does not publish that assumption on the visible page, so this guide does not make the extrapolation.
The distinction matters. A report updated in 2026 may contain a 2025 base year, a 2026 estimate, and a 2033 forecast. None of those labels should be dropped when the number is repeated.
Jewelry ecommerce growth has several meanings across these sources. It may refer to the overall jewelry market, the online distribution channel, company revenue, or marketplace merchandise value. Mixing those measures would blur the result.
Grand View Research forecasts the global jewelry market to reach USD 578.5 billion by 2033, with a modeled compound annual growth rate of 5.5% from 2026 through 2033. [1]
Within that model, online retail is forecast to grow at an 8.0% compound annual rate from 2026 through 2033. [1] This is a forward-looking estimate, not recorded annual sales and not a promise of uninterrupted growth.
Forecast providers may include different products, regions, currencies, and channel definitions. Combining incompatible forecasts into a new average would create a number that no source actually published.
Small word choices matter in a forecast. “Projected” and “modeled” tell you the number depends on assumptions. Terms such as “reached,” “recorded,” “sold,” and “reported” describe an observed result. Swap one set for the other and a careful outlook becomes a claim the source never made.
The U.S. Census Bureau estimated seasonally adjusted ecommerce sales of USD 340.2 billion in the second quarter of 2026. Ecommerce represented 17.1% of total U.S. retail sales for the quarter. [4]
Compared with the second quarter of 2025, ecommerce sales increased 12.2%. Total retail sales increased 6.7%. [4] The Census page labeled the release preliminary, subject to revision, and no longer the most up-to-date estimate as of September 28, 2026 because revised figures were scheduled for a later release.
That is a picture of U.S. retail as a whole. It cannot tell us whether online jewelry grew at the same pace or held the same share.
The Census figures are adjusted for seasonal variation but not for price changes. That means the reported dollar growth can reflect a mix of transaction volume, prices, and product mix. The release publishes margins of error, another reminder that an official estimate is not the same as a complete count of every sale.
Surveys of online jewelry buying behavior answer questions that revenue models cannot. They can show whether people have bought online, what motivates them, and where they browse. They cannot by themselves establish total sales value.
The Plumb Club’s 2023 survey covered more than 2,000 U.S. adults ages 25 to 60. Respondents had attended some college, reported household income of at least USD 75,000, and had purchased jewelry in the previous year or intended to buy in the next year. [2]
That screening makes the findings useful for a qualified jewelry audience, but the percentages should not be generalized to all U.S. adults.
Within the qualified 2023 sample, 62% had bought jewelry online and 46% had purchased watches online. [2] Keeping those categories separate avoids turning two survey responses into one combined jewelry figure.
Convenience prompted 64% of respondents to shop online rather than in a store, and the reported average online purchase budget was USD 1,355. [2]
Research was common too. Seventy percent used internet searches for jewelry research, and 85% felt enough reliable information was available to educate themselves. [2]
Those results help explain why accurate measurements, grading details, clear policies, and accessible support matter online. Research behavior may lead to either an online or offline purchase, so it is not the same as ecommerce revenue.
The average budget deserves the same caution. It reflects what these qualified respondents planned to spend online, not a typical transaction across the entire U.S. jewelry market. Use it as context for one survey audience, never as a spending rule for an engagement ring, gift, watch, or everyday piece.
The same 2023 survey measured jewelry consumer preferences across shopping channels, ranking direct brand websites at 31%, online marketplaces at 30%, and independent or local jeweler websites at 27% as preferred places to browse or buy. [2]
These rounded percentages describe reported channel preference within the qualified sample. They should not be added together as a market-share total, especially because shoppers may compare several destinations before deciding.
Browsing and buying can happen in different places. Someone may discover a style on social media, compare specifications on a brand site, ask a local jeweler a question, and complete the purchase elsewhere. A channel-preference survey captures part of that buying process, not a clean attribution model for the final sale.
An online jeweler should make product details, service terms, and post-purchase care easy to verify before checkout.
Do Amore’s lifetime warranty page shows what that level of detail looks like. It states that the limited lifetime warranty covers manufacturing defects, explains what it excludes, and describes the inspection process. A buyer can read the promise before relying on it, which turns reassurance into a policy that can be checked.
Mobile devices and social platforms can influence discovery, comparison, and checkout. The evidence is strongest when each stage is named rather than collapsed into one idea of a mobile or social sale.
Adobe measured USD 88.7 billion in U.S. online spending in October 2025, up 8.2% from October 2024. Its dataset spans more than one trillion retail-site visits, 100 million products, and 18 categories. [5]
Mobile devices generated an average 51.4% of revenue that month. Buy-now-pay-later spending reached USD 7.1 billion, up 7.6% year over year. [5]
Holiday shopping leaned even more heavily toward phones. Mobile represented 57.5% of Cyber Monday 2025 online sales, equal to USD 8.2 billion, compared with 41.4% in 2020. Thanksgiving 2025 reached a 61.6% mobile share. [6]
These are useful U.S. ecommerce benchmarks. Adobe does not present them as jewelry-specific shares, so this guide does not apply them to digital jewelry sales.
Mobile share can change with the occasion. A holiday event may produce a different device mix from an ordinary month because people respond to promotions, deadlines, and quick repeat visits. October and Cyber Monday answer different questions, which is why both the date and measured period remain visible. Social commerce for jewelry needs the same discipline because discovery, advertising influence, and checkout are separate behaviors.
The Plumb Club’s 2025 Industry and Market Insights project was a U.S. consumer survey of more than 2,000 people conducted with assistance from Qualtrics. Public material confirms the survey size and research partner but does not expose the full respondent-screening criteria. [3]
In the published summary, 44% of respondents had made a purchase on social media. Among respondents who had made a jewelry purchase through social media, 77% did so after seeing an ad for the item. [3]
The same summary reported that 26% considered an online presence important for jewelry retailers, up from 21% in the 2023 survey. [3] The findings show that visibility and advertising can shape the buying process, but they do not identify where every transaction was completed.
Nine in ten respondents who had used a website’s virtual try-on function in the 2023 Plumb Club study found it helpful. [2] That is a satisfaction result among feature users, not a measure of adoption across all jewelry shoppers.
Confidence depends on details that a simulation cannot replace. Look for clear imagery, dimensions, grading information, origin disclosures, shipping terms, return and resizing policies, warranty coverage, and a direct way to ask questions.
Do Amore’s online buying support explains its chat, text, phone, email, and video options, along with shipping, returns, and care. The practical benefit is simple. You can resolve uncertainty before committing to a high-consideration purchase.
Online luxury sales cover more than jewelry. Personal luxury goods include other categories, and hard luxury often combines jewelry with watches. Luxury data can show a wider consumer environment, but it should not be relabeled as online jewelry revenue.
Bain estimated the global personal luxury goods market at EUR 363 billion in 2024, down 2% from 2023 at current exchange rates. Online retained a 20% share. The channel declined 1% to 4% at current exchange rates. [7]
The spring 2026 Bain and Altagamma update placed the 2025 personal luxury goods market at EUR 358 billion. Its base case projected EUR 365 billion to EUR 373 billion for 2026, equal to forecast growth of 2% to 4%, with a stated 70% probability. [8]
Those euro totals cover personal luxury goods rather than jewelry alone. The 2024 historical channel result and the 2026 scenario come from separate report updates, so they should remain distinct.
Keeping Bain’s figures in euros is the cleaner choice. The reports distinguish current from constant exchange rates, and a dollar conversion would need its own exchange rate and date. Leaving the original units intact keeps the comparison tied to the published study.
In Bain’s June 2026 update, roughly half of luxury shoppers consulted the secondhand market before buying new. About half used AI somewhere in the buying process. [8]
About one in four luxury consumers used AI for brand or product discovery. Among AI users, two in three used it for product comparison. [8]
These findings describe broader luxury behavior. They do not show that half of jewelry buyers used AI, and they do not measure completed online jewelry purchases.
The RealReal’s second-quarter 2026 results offer a useful single-platform example. The authenticated luxury marketplace reported USD 617 million in gross merchandise value, up 22% year over year. Company revenue was USD 193 million, up 17%. [9]
Gross profit was USD 143 million and gross margin was 74.4%. Trailing-twelve-month active buyers reached 1,107,000, up 11%, and average order value was USD 659, up 13%. [9]
Gross merchandise value measures the value of goods sold through the platform. Revenue is what the company recognized under its accounting model. The RealReal sells across several luxury categories, including but not limited to fine jewelry and watches, so its company-wide growth should not be described as jewelry-category growth.
Platform measures still have value when their boundaries stay visible. Active buyers describe the size of an engaged customer base. Average order value describes an order within that platform. Neither tells us how much activity came from jewelry, how many items sat in each order, or what the same shoppers did elsewhere.
Compare the grading details first, then compare prices between stones with the same measurable traits.
Do Amore’s diamond grading guide breaks the comparison into cut, color, clarity, and carat weight, then explains how those traits affect appearance and price. That gives you a repeatable way to question two listings instead of trusting a headline price or a large carat number on its own.
For jewelry shopping online, a grading report is most useful when its number matches the stone under review and its measurements match the listing.
Statistics can frame the market, but the final decision still comes down to one item, one seller, and one set of policies. Use the engagement ring guide to understand the larger buying process, then verify the details that apply to the piece in front of you.
One final check can prevent confusion. Confirm which party stands behind each promise. A marketplace, payment provider, shipping carrier, grading laboratory, insurer, and jeweler may each cover a different part of the transaction. The most reassuring policy is the one you can locate, understand, and use if something goes wrong.
The most defensible 2026 trends are continuations of measured behavior, not claims that every jewelry category is changing in the same way.
Mobile-first browsing has a strong general ecommerce foundation. Adobe’s October 2025 and holiday 2025 data show phones accounting for more than half of online revenue during the measured periods. [5] [6] Jewelry-specific mobile share remains unknown in these sources.
Social discovery matters, but the available Plumb Club evidence separates general social purchases from jewelry purchases prompted by ads. [3] That distinction should remain visible when discussing social commerce.
Virtual try-on can help qualified users feel more confident. Detailed product information and human support remain important for sizing, grading, returns, and other purchase details. [2]
AI-assisted discovery and comparison are now visible in broader luxury research, and secondhand consultation is common in the same 2026 study. [8] Neither finding establishes a jewelry-only checkout rate.
Finally, the modeled online jewelry channel is forecast to grow at 8.0% annually from 2026 through 2033. [1] A forecast can guide questions about direction, but it should not be presented as sales already recorded.
When a new report appears, check four things before using its headline number. Start with the data year, then identify the metric, the population and geography, and the published methodology. Revenue, merchandise value, order value, buyer incidence, and channel preference tell very different stories. If those details are missing, treat the figure as directional.
Then ask what the statistic leaves out. A global market estimate may not reveal one country’s buying habits. A U.S. survey may exclude lower-income or older shoppers. A retailer result reflects its own assortment and customer base. Those limits define where each statistic can be used responsibly.
One global jewelry model supports a calculated 2025 online share of 16.1%. The method is 100% minus Grand View Research’s published 83.9% offline share. [1] It is an author calculation within that model, not a directly published universal share, and regional or category mixes may differ.
Using Grand View Research’s USD 381.5 billion global jewelry estimate for 2025 and the calculated 16.1% online share produces approximately USD 61.4 billion. [1] The calculation is USD 381.5 billion multiplied by 16.1%, rounded to one decimal place. The USD 397.7 billion 2026 figure is for the total jewelry market, not online sales.
Grand View Research forecasts the online jewelry distribution channel to grow at an 8.0% compound annual rate from 2026 through 2033. [1] That is a modeled outlook. Observed general U.S. ecommerce grew 12.2% year over year in the second quarter of 2026, but the Census figure covers all retail and cannot be assigned to jewelry. [4]
Yes, some shoppers do, but the available evidence here does not provide a universal global percentage for engagement-ring purchases. Surveys can define online research, purchase channels, and buyer populations differently, so a single share should not be generalized beyond its stated sample.
For a high-consideration purchase, focus on grading documentation, visible dimensions, origin disclosures, secure shipping, returns, resizing, and access to knowledgeable support rather than assuming the channel alone determines confidence.
Among the online jewelry sales statistics in this guide, the strongest jewelry-only estimate places modeled 2025 online revenue at about USD 61.4 billion. Buyer research shows that convenience, information, and support shape how people shop. [1] [2] The broader ecommerce, luxury, and marketplace figures add context, but they do not replace jewelry-specific evidence.
When you are ready to move from market context to a real piece, browse Do Amore’s jewelry collection at your own pace. If engagement rings are your focus, compare engagement ring settings in a separate step so each link serves one clear decision.
Start with the collection that fits your question, then ask Do Amore for help whenever a grading, sizing, or policy detail needs a second look.
Do Amore’s clean-water impact gives each purchase a purpose beyond the transaction. Let that meaning land after the practical details feel right, with no pressure to rush the choice.