



Your bag is empty
Explore timeless jewelry that carries love and inspires lasting impact.
We promise that every purchase you make gives one person access to clean, life-changing water.
Explore timeless jewelry that carries love and inspires lasting impact.
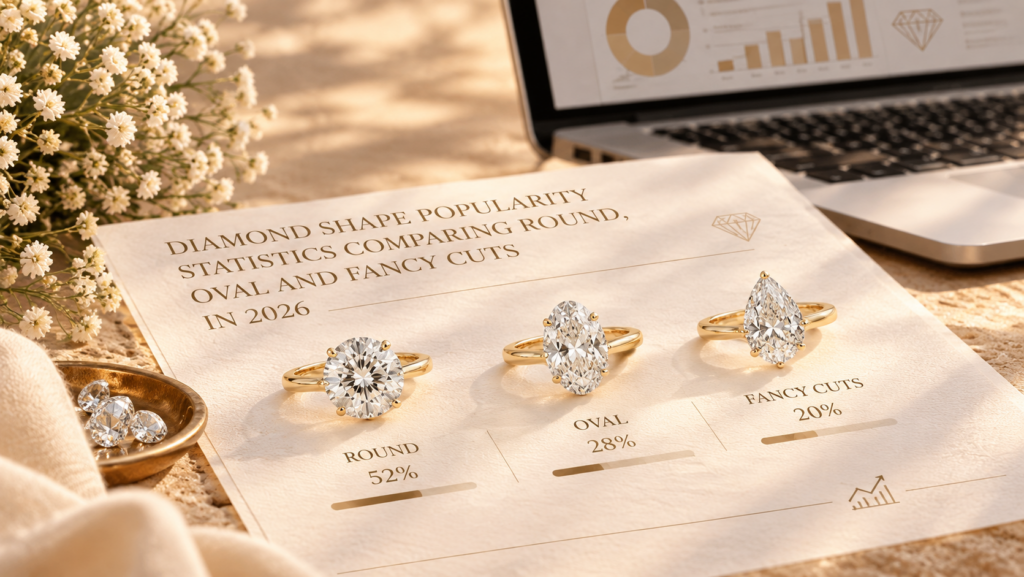
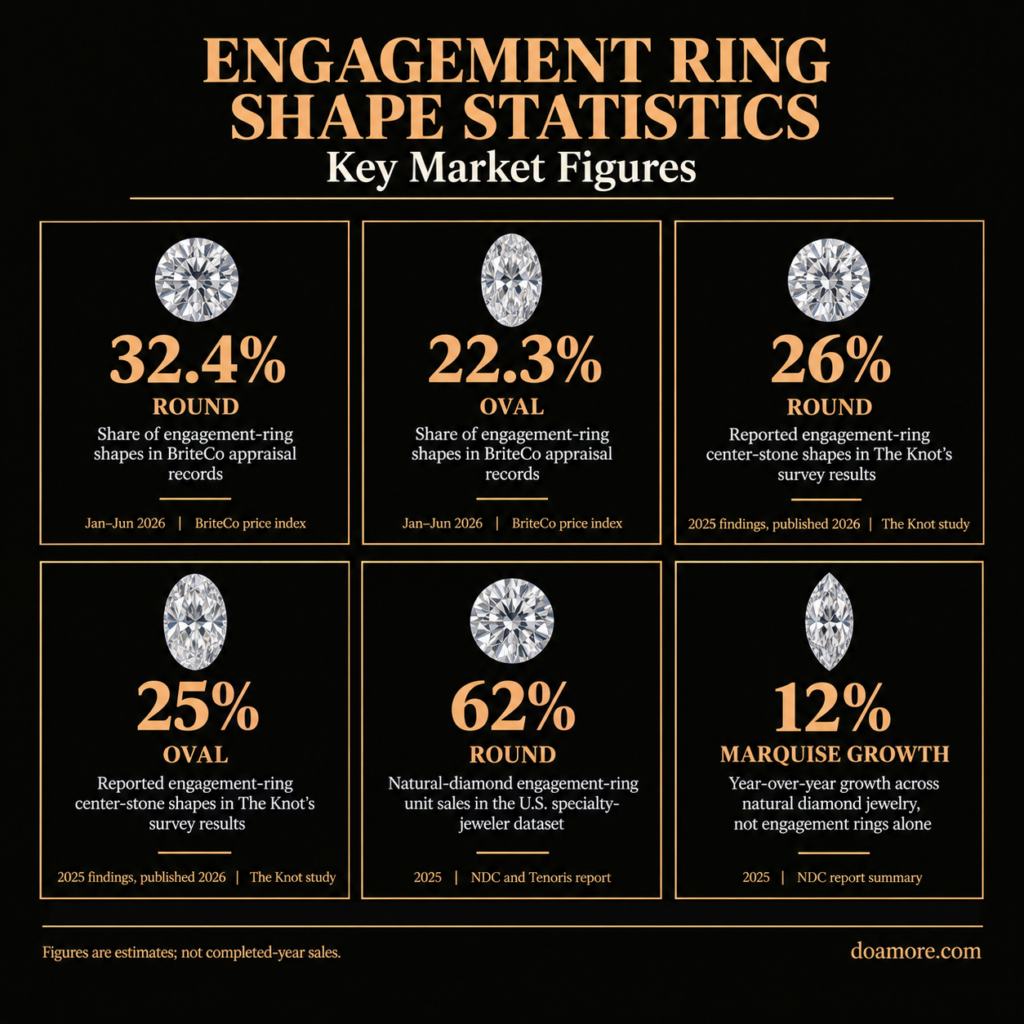
Round remains the most popular diamond shape in the latest datasets, but its lead depends on the group being measured. BriteCo’s Jewelry, Diamond & Watch Price Index puts round at 32.4% and oval at 22.3% of its engagement-ring appraisal records from January through June 2026. The Knot’s 2026 Real Weddings Study reports a much closer result, with round at 26% and oval at 25%.
These are different populations, not competing estimates of one national market share. BriteCo measures appraised rings. The Knot reports survey findings, and natural-diamond sales data covers another part of the market. The figures below keep those boundaries visible so each statistic can be used accurately.
| Statistic | What it measures | Year + source |
| 32.4% round | Share of engagement-ring shapes in BriteCo appraisal records | Jan–Jun 2026; BriteCo price index |
| 22.3% oval | Share of engagement-ring shapes in BriteCo appraisal records | Jan–Jun 2026; BriteCo price index |
| 26% round | Reported engagement-ring center-stone shapes in The Knot’s survey results | 2025 findings, published 2026; The Knot study |
| 25% oval | Reported engagement-ring center-stone shapes in The Knot’s survey results | 2025 findings, published 2026; The Knot study |
| 62% round | Natural-diamond engagement-ring unit sales in the U.S. specialty-jeweler dataset | 2025; NDC and Tenoris report announcement |
| 12% marquise growth | Year-over-year growth across natural diamond jewelry, not engagement rings alone | 2025; NDC report summary |
BriteCo’s price index ranks round first at 32.4% and oval second at 22.3% for January through June 2026. Emerald follows at 9.1%, cushion at 8.5%, radiant at 7.4%, and marquise at 6.1%. Those figures describe engagement-ring shapes in the company’s appraisal data.
That ranking gives readers a current picture of the records entering BriteCo’s database. It does not establish the shape mix of every ring sold in the United States. Appraisal records depend on which jewelers participate and which purchases reach the appraisal process.
BriteCo’s research methodology describes a broader database of hundreds of thousands of de-identified appraisals from more than 4,000 independent retail-jeweler partners. The shape table does not provide a separate sample size for each year, so that network total should not be presented as the number of rings behind any individual percentage.
For shoppers, a ranking is a useful starting point for comparing outlines. Do Amore’s diamond shape guide explains the visual differences between those options. Popularity can help you build a shortlist, but it cannot decide which outline suits the wearer.
The clearest recent comparison comes from following the same publisher over time. BriteCo’s historical series shows round losing share and oval gaining share between 2023 and the first half of 2026. The final period covers only January through June.
| Data period | Round | Oval | Other reported leading shapes | Original source |
| Jan–Jun 2026 | 32.4% | 22.3% | Emerald 9.1%; cushion 8.5%; radiant 7.4%; marquise 6.1% | BriteCo |
| 2025 | 35.2% | 22.0% | Emerald 9.1%; cushion 8.1%; radiant 7.2%; pear 5.4% | BriteCo |
| 2024 | 39.0% | 21.4% | Emerald 8.7%; cushion 7.3%; radiant 6.6%; pear 5.3% | BriteCo |
| 2023 | 41.9% | 20.5% | Emerald 7.4%; cushion 6.7%; radiant 5.8%; pear 5.4% | BriteCo |
Calculated from BriteCo’s published shares, round declined by 9.5 percentage points between 2023 and January–June 2026, from 41.9% to 32.4%. Oval increased by 1.8 percentage points, from 20.5% to 22.3%. These are percentage-point changes, not percentage growth rates.
The smaller categories show movement too. In BriteCo’s series, emerald rose from 7.4% in 2023 to 9.1% in the first half of 2026, cushion moved from 6.7% to 8.5%, and radiant increased from 5.8% to 7.4%. Marquise appears in the latest leading group where pear appeared in the earlier lists.
These observations do not prove that one shape took sales directly from another. The records do not establish whether price, social media, celebrity rings or changes in availability caused the shifts. They show how the recorded shape mix changed within this source.
The Knot’s 2026 Real Weddings Study places round at 26% and oval at 25%. Emerald, princess, pear or teardrop, and marquise each account for 8% of reported shapes. Round’s lead over oval is one percentage point, calculated from the published results.
The Knot’s report includes a core sample of 10,474 U.S. couples married in 2025, recruited through The Knot and WeddingWire. Its methodology says the report contains additional studies of engaged and newlywed couples conducted during that year. It does not provide a separate question-level sample size beside the ring-shape figures.
That distinction matters when quoting the results. Describe them as The Knot’s reported survey findings, not as a count of all engagement rings purchased nationally. The report’s publication year is 2026, but its main wedding cohort married in 2025, and some rings may have been purchased earlier.
The same report ranks cut or shape first among engagement-ring features, ahead of style or setting and metal. This helps explain why shape deserves its own comparison rather than being treated as a minor design detail.
For spending, shopping and ring-selection context beyond shape, see Do Amore’s engagement ring statistics.
The Natural Diamond Council’s announcement of its 2025 Tenoris report puts round at 62% of natural-diamond engagement-ring unit sales. The wider report draws on more than four million jewelry transactions from 2,500 specialty jewelers across the United States.
This is a sales dataset for natural diamonds in a defined retail channel. It excludes the laboratory-grown segment and should not be treated as a measure of all U.S. ring purchases.
For the wider category, Do Amore’s jewelry statistics compare market size, product categories and shopping habits beyond engagement rings.
NDC’s own report summary identifies 12% year-over-year growth for marquise and 7% for emerald during 2025. Those growth figures cover natural diamond jewelry as a whole, not engagement rings alone. They are rates of change, not the shares of engagement rings featuring those shapes.
The difference is easy to lose in a graphic. Round’s engagement-ring sales share and marquise’s jewelry growth can sit in the same summary only when their labels preserve those different measures.
The Knot’s 2026 study reports that laboratory-grown center stones account for 61% of engagement-ring purchases in its findings. Its natural-versus-lab-grown comparison lists round as the leading shape for natural stones and oval for lab-grown stones.
That comparison supplies the leading shape in each group, but it does not publish the percentage choosing each shape within each origin category. The overall round and oval shares cannot be reused as origin-specific percentages.
Do Amore’s lab-grown diamond market statistics provides wider context on adoption and pricing. Combine those measures with shape popularity only when a source reports both for the same group.
Choosing an origin and choosing an outline are separate decisions. Compare natural and lab-grown candidates within the shape you prefer, then assess their individual quality and price rather than treating the most common outline as the best purchase.
Appraisal records, survey responses and retail transactions each capture a different part of the market. A useful comparison starts with what each source counted.
| Evidence | What was counted | Data period | Main limitation |
| BriteCo price index | Engagement-ring shapes in appraisal records | Latest period Jan–Jun 2026 | Partial year; no year-specific shape-table sample size |
| The Knot study | Survey-reported engagement-ring center-stone shapes | 2025 findings, published 2026 | Survey population; no question-level sample size beside the shape figures |
| NDC and Tenoris | Natural-diamond engagement-ring units sold | 2025 | Natural diamonds and participating U.S. specialty jewelers only |
A percentage is meaningful only with its population attached. Combining these findings into a single average would mix different events and audiences. The sources are useful alongside one another, but none should be relabeled as a complete global diamond-shape census.
Search interest and retailer inventory introduce further distinctions. Searches measure attention, and inventory records what a seller offers. Neither automatically measures ownership or completed purchases. A trend claim should identify the evidence behind it before drawing conclusions about what buyers chose.
Do Amore’s online jewelry sales statistics provide further context on shopping channels and reported buyer behavior, which should be kept separate from shape preferences.
The latest evidence gives readers a more precise story than a single list of fashionable cuts.
BriteCo’s 2026 update keeps round in first place but shows a smaller lead over oval than in its earlier records. The Knot’s 2026 study puts the same pair close together in its survey findings. Neither result makes oval the leader across every market.
The NDC report summary adds a separate angle by reporting growth in marquise and emerald across natural diamond jewelry. That broader category should not be turned into an engagement-ring forecast.
For anyone quoting these statistics, the useful development is the ability to distinguish current appraisal patterns, newlywed survey results and natural-diamond retail activity. Keep the date and measure in the sentence with the number. A shorter statement with the correct scope is more useful than a dramatic claim that combines incompatible evidence.
GIA’s diamond-cut guidance separates shape from the workmanship and light behavior assessed in cut quality. A popular outline does not guarantee that an individual diamond is well cut.
In its 2024 research on oval, pear and marquise diamonds, GIA describes observations gathered from 166 trade participants in 2014 and 2015. Most examined sets containing 36 diamonds. These are research sample counts, not consumer preferences or market shares.
The research found broad dislike of prominent windowing, with more varied opinions about bow ties and crushed-ice patterns. Those differences help explain why diamonds with the same outline can look quite different. The study examines appearance, not which shape sold most often.
Use Do Amore’s shape-by-shape diamond guides to compare the qualities of individual stones after choosing an outline.
Round leads BriteCo’s January–June 2026 appraisal data at 32.4%, followed by oval at 22.3%. These are partial-year appraisal results, not completed full-year national sales shares.
Within BriteCo’s comparable series, oval increased from 20.5% in 2023 to 22.3% in the first half of 2026. That supports a trend within its records, not a claim that oval is gaining share in every retail channel.
No. GIA’s cut guidance explains that cut quality concerns how a diamond interacts with light. A popularity ranking measures frequency within a dataset and cannot grade an individual stone.
Use these rankings to identify shapes you want to see side by side, then compare the individual diamonds and settings. Explore Do Amore’s engagement rings to find an outline that fits your taste, budget and everyday wear.