




Your bag is empty
Explore timeless jewelry that carries love and inspires lasting impact.
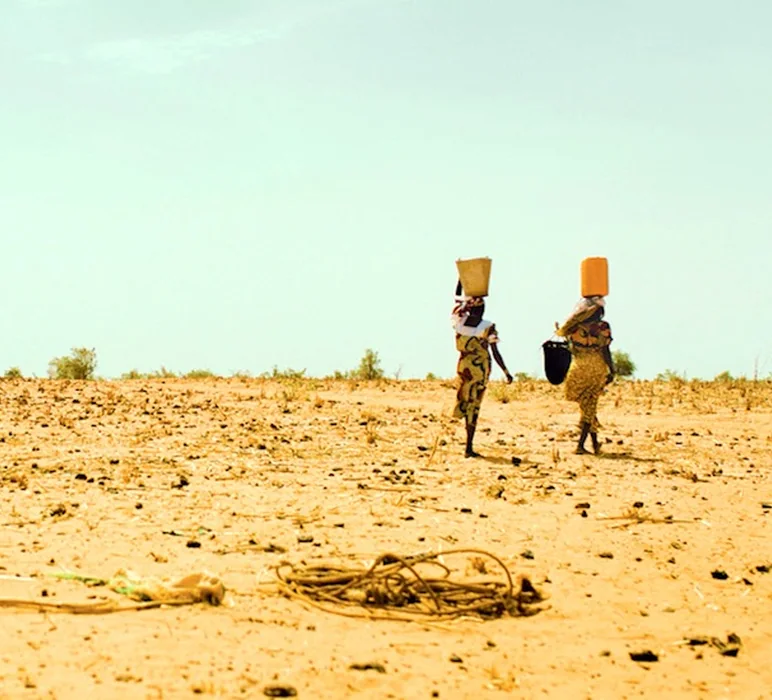
We promise that every purchase you make gives one person access to clean, life-changing water.
Explore timeless jewelry that carries love and inspires lasting impact.
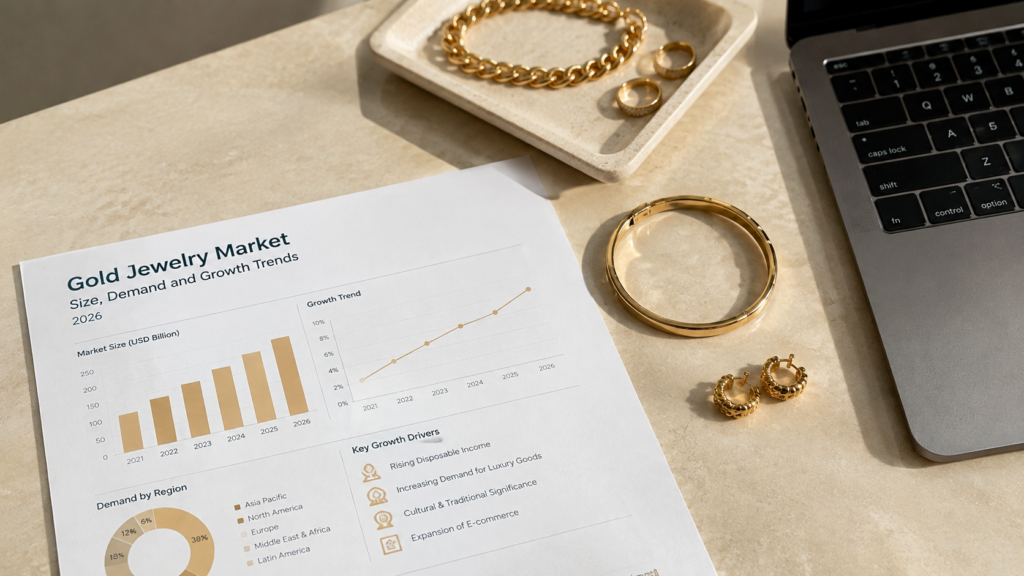
The gold jewelry market is telling two stories at once. Consumers bought less gold by weight in 2025 and the first half of 2026, but the amount they spent rose. Record gold prices explain much of that split. (World Gold Council full-year data) (World Gold Council Q2 data)
This page covers the global gold jewelry market by separating observed demand from private market-size estimates. It distinguishes jewelry fabrication and consumption from total gold demand, which includes bars, coins, exchange-traded funds, central banks, and technology. The latest complete annual jewelry data is for 2025. The latest 2026 demand data covers January through June, so it should not be read as a full-year result. (World Gold Council full-year data) (World Gold Council Q2 data)
| Statistic | What it measures | Year + source |
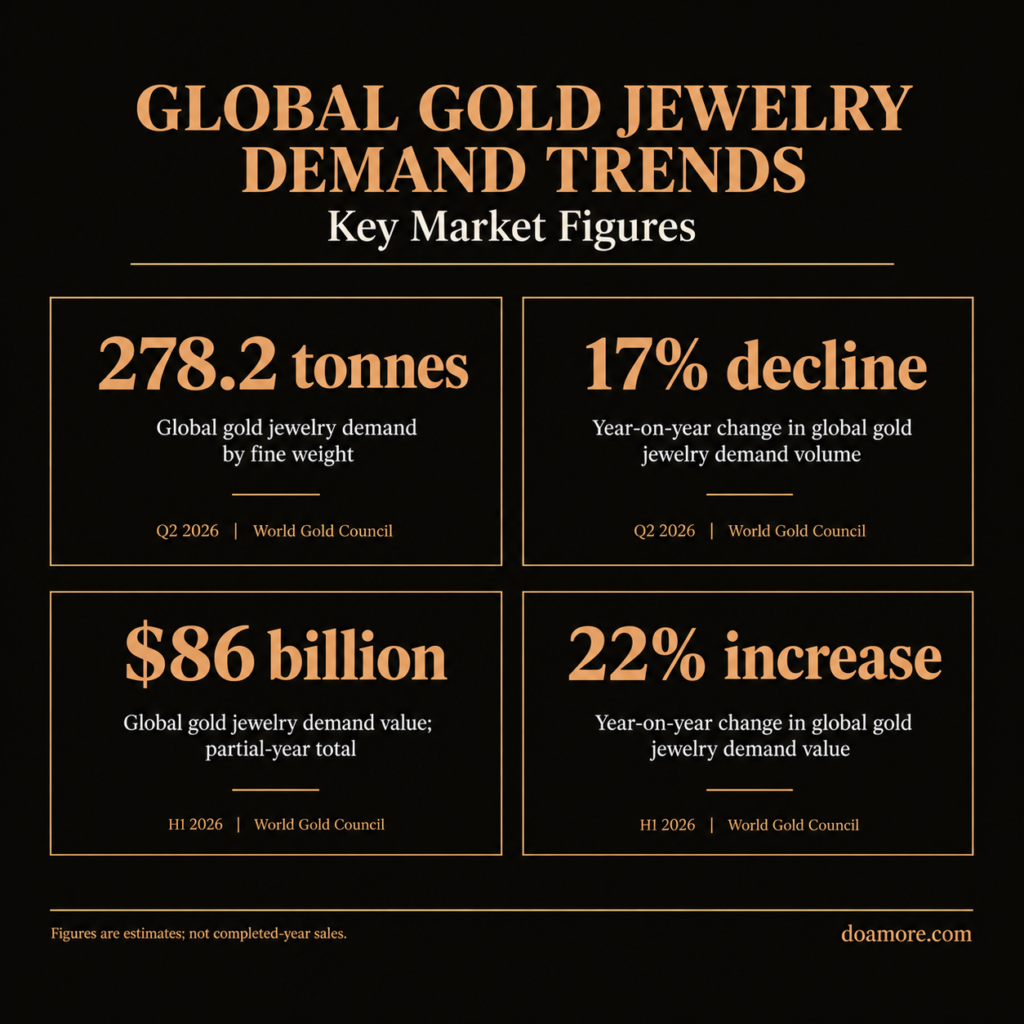
| 278.2 tonnes | Global gold jewelry demand by fine weight | Q2 2026 | World Gold Council |
| 17% decline | Year-on-year change in global gold jewelry demand volume | Q2 2026 | World Gold Council |
| $86 billion | Global gold jewelry demand value; partial-year total | H1 2026 | World Gold Council |
| 22% increase | Year-on-year change in global gold jewelry demand value | H1 2026 | World Gold Council |
The clearest way to interpret gold jewelry market data is to keep tonnes, nominal dollars, total gold demand, and commercial forecasts separate.
The World Gold Council reports gold jewelry consumption in tonnes and in U.S. dollar value. Its jewelry series is narrower than the total gold market. Total demand includes investment, central-bank buying, technology use, and over-the-counter activity.
That distinction changes the picture. Total gold demand, including over-the-counter transactions, reached 5,002.3 tonnes and $555 billion in 2025. Jewelry demand in the same year was 1,542.3 tonnes and $172 billion. (World Gold Council full-year data) (World Gold Council) A figure for total gold demand should not be labeled as jewelry demand.
For a broader view of adjacent categories, see Do Amore’s jewelry market statistics. That page covers diamonds, gemstones, metals, and retail indicators beyond gold alone.
Tonnes measure how much fine gold is contained in jewelry demand. Dollar value measures what that gold was worth at prevailing prices. A reported gold jewelry market value may reflect retail revenue, manufacturer sales, or another proprietary definition. These measures answer different questions.
The contrast was especially clear in 2025. The annual average gold price rose 44% to $3,431 per troy ounce, but jewelry volume fell 18% and jewelry value rose 18%. (World Gold Council full-year data) (World Gold Council) Higher spending did not mean consumers acquired more gold.
World Gold Council figures in this article are historical demand results. The three market-size estimates below come from commercial research firms. Their values are model outputs, not a single observed industry total. Each provider uses its own market boundary, inputs, currency assumptions, and forecast period.
A historical figure describes a period that has ended. An estimate assigns a value to a current or recent period that may not be directly observed. A forecast extends assumptions into a future period. Keeping those labels visible prevents a modeled revenue figure from being mistaken for measured tonnage.
Jewelry products vary widely in purity. A finished piece may contain other metals for color, strength, or price. Reporting demand as tonnes of fine gold puts those products on a common metal-content basis. It does not describe the gross weight of finished jewelry sold at retail.
Fine-gold weight is useful for comparing physical demand across markets and periods. It does not capture labor, gemstones, branding, retail margins, taxes, or the full price of a finished piece. Revenue estimates can include some of those elements, depending on the provider. That is another reason tonnage and revenue should remain separate. The same material context helps readers compare gold versus platinum for a ring before they evaluate design or price.
Lower-karat gold usually contains more strengthening alloy, and higher-karat gold contains more pure gold and carries a richer color. The better fit depends on how much you value daily durability versus gold content.
Do Amore’s current gold guidance explains this trade-off across its solid-gold options in plain terms. That product-level choice matters more to a buyer than global tonnage alone.
Published 2026 estimates place the gold jewelry market between $269.43 billion and $402.98 billion, but each figure belongs to a different provider model. (Mordor Intelligence) (Deep Market Insights) (360iResearch)
No universally accepted 2026 revenue total exists. Three provider estimates differ by more than $133 billion because their methodologies and covered value chains are not identical. (Mordor Intelligence) (Deep Market Insights) (360iResearch)
Published provider estimates:
| Provider | 2025 base | 2026 estimate | End forecast | CAGR | Scope note |
|---|---|---|---|---|---|
| Mordor Intelligence | $392.02B | $402.32B | $468.89B (2031) | 3.11% | Proprietary model (Mordor Intelligence) |
| Deep Market Insights | $392.50B | $402.98B | $459.73B (2031) | 2.67% | Proprietary model (Deep Market Insights) |
| 360iResearch | $256.62B | $269.43B | $373.33B (2032) | 5.50% | Proprietary model (360iResearch) |
Mordor Intelligence estimates the market at $392.02 billion in 2025 and $402.32 billion in 2026, then projects $468.89 billion by 2031 at a 3.11% compound annual growth rate. (Mordor Intelligence) Deep Market Insights estimates $392.50 billion in 2025, $402.98 billion in 2026, and $459.73 billion in 2031, with a 2.67% compound annual growth rate. (Deep Market Insights)
360iResearch reports a lower base. It estimates $256.62 billion in 2025 and $269.43 billion in 2026, then forecasts $373.33 billion by 2032 at a 5.50% compound annual growth rate. (360iResearch) These values should be cited with the provider name rather than blended into one headline number.
Scope drives much of the gap. One model may track retail spending, another may focus on supplier revenue, and a third may define product or geography differently. Exchange rates and gold-price assumptions influence nominal dollar results.
The cleanest approach is to stay within one provider’s series. State its definition, then compare its base year with that provider’s endpoint. Mixing one firm’s base year with another firm’s forecast can create growth that neither source reports.
The disagreement extends to market structure. Mordor assigns 81.27% of 2025 sales to offline retail and expects online sales to grow at 5.23% annually through 2031. (Mordor Intelligence) Deep Market Insights places offline channels at about 68% of 2025 revenue. (Deep Market Insights) The gap is a warning against treating a proprietary segment estimate as an audited industry count.
Gold jewelry market growth forecasts are useful for comparing scenarios within one provider’s model. They are less reliable when figures from different providers are combined without reconciling definitions.
The latest complete year shows lower gold jewelry demand by weight but record nominal value, and the first half of 2026 continued the same split.
Global jewelry demand was lower year over year in every quarter of 2025. Full-year volume fell to 1,542.3 tonnes, an 18% decrease from 2024. The World Gold Council attributed the weakness to record prices, economic uncertainty, and pressure on affordability. Annual demand value still climbed 18% to a record $172 billion. (World Gold Council full-year data)
The fourth quarter captured the same volume-value split. Jewelry demand was 441.5 tonnes, but the average gold price for the quarter reached $4,135 per ounce, 55% higher than a year earlier. (World Gold Council full-year data) (World Gold Council)
Supply did not rise nearly as fast as price. Global mine production edged up 1% to 3,671.6 tonnes in 2025, and recycled supply increased 3% to 1,404.3 tonnes. (World Gold Council) Those are whole gold-market figures, not jewelry-only inputs.
The year opened with the same split between volume and value. Global jewelry demand fell 23% year over year to 299.7 tonnes, but its value rose 31% to $47 billion. (World Gold Council Q1 data) Consumers spent more cash on less metal.
Volume slipped again in the second quarter. Global jewelry demand was 278.2 tonnes, 17% below the 335.3 tonnes recorded in the second quarter of 2025. (World Gold Council Q2 data) Combining the reported quarters gives about 577.9 tonnes for the first half of 2026. This sum is calculated from the two quarterly World Gold Council results and is not a published full-year estimate.
The value picture moved in the other direction. First-half spending reached $86 billion, up 22% from $71 billion in the first half of 2025. (World Gold Council Q2 data) The comparison is nominal and does not remove the effect of higher gold prices.
The wider gold market followed a different path. Total gold demand in the first half of 2026 rose 2% to 2,522 tonnes and reached $380 billion in value. (World Gold Council Q2 report) Jewelry was a declining physical-demand segment inside a growing total market.
India and mainland China remained the largest national markets by fine-gold weight in 2025, with lower volumes continuing into the first half of 2026.
India remained the largest national jewelry market by weight in 2025. Demand fell 24% to 430.5 tonnes as high prices reduced purchase volumes. (World Gold Council full-year data)
The decline continued into 2026. First-quarter demand was 66.1 tonnes, down 19% from a year earlier, but value reached $10 billion. (World Gold Council Q1 data) Second-quarter demand was 75.1 tonnes, down 15% from 88.8 tonnes in the same period of 2025. (World Gold Council Q2 data)
For the first half, Indian consumers bought 141 tonnes of gold jewelry, 17% less than a year earlier. Spending still rose 26% to $21 billion. (World Gold Council Q2 data) Weddings and festivals continued to shape timing, but high prices encouraged lighter pieces, lower initial weights, and exchanges of old jewelry.
Mainland China was the second-largest country market by weight in 2025. Annual demand fell 25% to 360.1 tonnes. (World Gold Council full-year data)
First-quarter 2026 demand dropped 32% to 85.2 tonnes, even as value increased 16% to $13 billion. (World Gold Council Q1 data) In the second quarter, demand fell 28% to 50.0 tonnes from 69.2 tonnes a year earlier. (World Gold Council Q2 data)
First-half demand totaled 136 tonnes, down 30%. Spending rose 11% to $21 billion. (World Gold Council Q2 data) China followed the global pattern, with higher spending alongside a sharp contraction in weight.
U.S. jewelry demand fell 11% to 117.3 tonnes in 2025, but spending increased 28% to $13 billion. (World Gold Council full-year data) In the second quarter of 2026, U.S. demand was 22.2 tonnes, down 25% year over year. (World Gold Council Q2 data)
European demand excluding the Commonwealth of Independent States fell 10% to 60.6 tonnes in 2025, but annual value reached $7 billion. (World Gold Council full-year data) Second-quarter 2026 demand for the same region was 12.5 tonnes, down 10%. (World Gold Council Q2 data)
Several smaller Asian markets moved differently. In the second quarter of 2026, Hong Kong jewelry demand rose 15% to 4.3 tonnes, South Korea increased 6% to 2.8 tonnes, and Japan fell 25% to 2.2 tonnes. (World Gold Council Q2 data) These are quarterly changes, not full-year trends.
Higher gold prices can increase nominal spending even when jewelry consumption by weight falls.
Across both periods, value and volume moved in opposite directions. In 2025, global jewelry volume fell 18% but value rose 18%. In the first quarter of 2026, volume fell 23% but value rose 31%. In the first half, spending increased 22% even as the two reported quarters together delivered about 577.9 tonnes of demand. (World Gold Council full-year data) (World Gold Council Q1 data) (World Gold Council Q2 data)
Nominal growth can overstate underlying consumption. A market can generate more revenue because each gram costs more, even when buyers take home less gold. Inflation-adjusted or constant-price data would answer a different question, but the cited sources report nominal U.S. dollar values.
The country reports describe recurring adjustments: lower-weight pieces, exchanges of old jewelry, purchases at lower purities, and more selective buying. These responses help preserve participation but reduce the amount of new gold required per purchase.
India illustrates the effect. First-half 2026 volume fell 17%, yet value rose 26%. Mainland China showed a 30% volume decline alongside an 11% increase in spending. (World Gold Council Q2 data) Revenue alone hides the affordability pressure visible in tonnes.
Recycled gold can be refined to the same purity as newly mined gold, so recycled content does not make a ring weaker or less attractive.
Do Amore explains that its recycled precious metals return to their original elements with no difference in strength or appearance. For shoppers, that means sourcing and quality can be evaluated as separate questions.
Supply figures cover the whole gold market, so they should not be treated as jewelry supply. In the first quarter of 2026, total gold supply rose 2% to 1,230.9 tonnes. Mine production increased 2% to 884.7 tonnes, recycled gold increased 5% to 366.0 tonnes, and producer hedging was negative 19.7 tonnes. (World Gold Council supply data)
The World Gold Council excludes old-for-new jewelry exchanges from recycled supply when the exchange has no net impact on market supply. (World Gold Council methodology) That methodology matters in countries where consumers trade old pieces toward new purchases.
Trade data is omitted from the headline market-size series because exports measure cross-border shipments, not domestic consumer demand. Mixing trade values with retail revenue or tonnage would create an inconsistent total.
Gold jewelry market trends for 2026 are best read as either observed consumer adjustments or modeled product and channel forecasts.
With gold expensive, weight became a practical design constraint. World Gold Council country commentary repeatedly points to lighter pieces, reduced purchase weights, and old-for-new exchange activity in 2025 and 2026. (World Gold Council full-year data) (World Gold Council Q1 data) (World Gold Council Q2 data)
Commercial forecasts identify product mix as a market driver. Mordor estimates rings held 32.34% of 2025 revenue and 22-karat jewelry held 47.23%. (Mordor Intelligence) Deep Market Insights estimates bridal purchases represented more than 38% of 2025 revenue. (Deep Market Insights) These are provider estimates, so they should not be read as audited shares.
For related context on bridal demand, Do Amore’s engagement ring statistics track proposal behavior, budgets, styles, and shopping patterns.
Store-based channels still hold the larger share of gold jewelry sales in commercial forecasts, but the precise level is unsettled. Mordor estimates an 81.27% offline share in 2025 and projects online sales to grow at a 5.23% annual rate through 2031. (Mordor Intelligence) Deep Market Insights estimates a 68% offline share for the same base year. (Deep Market Insights)
Do Amore’s online jewelry sales statistics provide a separate view of digital shopping, buyer behavior, and e-commerce growth. Channel statistics should be combined with total market-size estimates only when the underlying definitions match.
This page was researched on October 22, 2026. Historical demand and supply figures come from World Gold Council publications. Commercial market-size values come from each research firm’s public report page.
The latest observed 2026 jewelry-demand period used here ends June 30, 2026. First-half figures must not be presented as annual totals. The market-size forecasts are nominal U.S. dollar estimates and may differ in product coverage, revenue level, geography, exchange-rate treatment, and price assumptions. (World Gold Council Q2 data) (Mordor Intelligence) (Deep Market Insights) (360iResearch)
Percent changes come from the source except when a calculation is identified. The 577.9-tonne first-half total is the sum of 299.7 tonnes in the first quarter and 278.2 tonnes in the second quarter. Rounding means a recomputed percentage may differ slightly from a published rate. (World Gold Council Q1 data) (World Gold Council Q2 data)
Priority went to original publishers. World Gold Council tables were used for historical demand and supply. Public pages from the three forecast providers were used only for the estimates each firm attributes to its own model. Company reposts, search-result snippets, and competitor-authored claims were not accepted as independent proof.
Every cited page was checked for the exact value, period, geography, currency, unit, and status as a historical result or forecast. Sources that could not be opened and checked directly during verification were excluded from the publishable statistics. The result is deliberately narrower than a roundup built from secondary summaries.
Jewelry tonnage does not count the number of pieces sold. One heavy item and several light items can contain the same amount of fine gold. Dollar value is sensitive to price and exchange rates, but commercial revenue estimates may include parts of the value chain that demand tables do not.
Country totals reflect local market conventions and data availability. Quarterly figures can be affected by the timing of festivals, weddings, inventory decisions, and price moves. A single quarter should be read with the annual and first-half comparisons nearby.
This page uses the newest directly verifiable data available on the research date. A later quarterly release may revise prior figures or add another part of 2026. Any update should preserve the distinction between partial-year results and a completed calendar year, retain the original source links, and recheck calculations after revisions.
Gold jewelry market questions are easiest to answer when physical tonnes, nominal dollars, historical results, and forecast estimates remain separate.
Published commercial estimates range from $269.43 billion to $402.98 billion. (Mordor Intelligence) (Deep Market Insights) (360iResearch) The range reflects different methodologies, so every gold jewelry market forecast should keep the provider and definition attached.
By physical weight, the latest data says no. First-quarter demand fell 23% year over year, and second-quarter demand fell 17%. (World Gold Council Q1 data) (World Gold Council Q2 data) By nominal value, first-half spending grew 22% to $86 billion. (World Gold Council Q2 data)
India and mainland China were the largest country markets by weight in 2025, at 430.5 tonnes and 360.1 tonnes. (World Gold Council full-year data) Both recorded lower volumes in the first half of 2026.
A higher gold price can lift the dollar value of each gram. In 2025, the annual average price rose 44%, jewelry weight fell 18%, and jewelry value increased 18%. (World Gold Council full-year data) (World Gold Council)
The total gold market includes jewelry, investment, central-bank demand, technology, and over-the-counter activity. Jewelry is one segment. In 2025, total demand including over-the-counter transactions was 5,002.3 tonnes, compared with 1,542.3 tonnes of jewelry demand. (World Gold Council full-year data) (World Gold Council)
Gold jewelry market averages can frame price and demand, but they cannot decide what the right ring should represent. Compare purity, durability, sourcing, and service at the product level before you buy.
Do Amore connects every purchase to clean water access and provides details of the supported water project. See how the impact model works, then decide whether that meaning belongs in your choice.