Your Bag Is Empty
Explore timeless jewelry that carries love and inspires lasting change
Every purchase gives one person access to clean, life-changing water.
Explore timeless jewelry that carries love and inspires lasting change
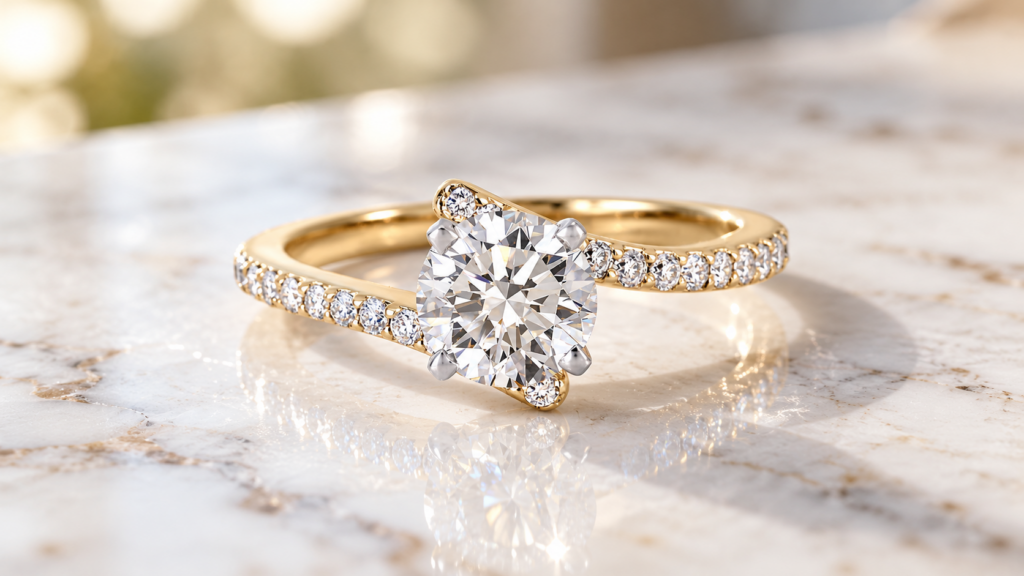
Published models project growth in the lab grown diamond market, but no single official 2026 total exists. One global model values the market at $29.46 billion in 2025 and estimates $33.54 billion for 2026. Another values 2025 at $12.07 billion and estimates $12.6 billion for 2026. These are modeled dollar values, not confirmed 2026 sales, and their public scopes are not compatible enough to combine.[1][2]
The gap itself is useful. Market size, U.S. engagement-ring adoption, retail prices, India’s polished exports and industrial diamond production measure different parts of the category. Keeping every figure tied to its year, geography, unit and method shows what the evidence can support.
A market estimate is only meaningful when you know what sits inside it. Fortune Business Insights covers lab-grown diamonds across jewelry and industrial applications and models $29.46 billion in 2025. It estimates $33.54 billion in 2026, then forecasts $91.85 billion by 2034, a 13.42% compound annual growth rate for 2026 through 2034.[1]
Grand View Research uses the broader label “synthetic diamond market.” It reports $12.07 billion for 2025, estimates $12.6 billion in 2026 and forecasts $16.32 billion in 2033. Its stated compound annual growth rate is 3.8% for 2026 through 2033.[2]
Both sources publish global U.S. dollar models that include jewelry and industrial uses. Their different values and growth paths should remain side by side. A midpoint would imply a shared methodology the public summaries do not establish.
| Source | Public terminology | 2025 value | 2026 status | Forecast endpoint | CAGR | Scope |
| Fortune Business Insights | Lab-grown diamond market | $29.46B | $33.54B estimate | $91.85B in 2034 | 13.42%, 2026–2034 | Global: jewelry and industrial |
| Grand View Research | Synthetic diamond market | $12.07B | $12.6B estimate | $16.32B in 2033 | 3.8%, 2026–2033 | Global: jewelry and industrial |
“Market size” covers several unlike measures. A global research model estimates revenue across defined applications. A retailer records transactions. Appraisal datasets may infer sales prices from appraised pieces.
Trade bodies report exports at a customs boundary. Industrial surveys measure manufactured material in carats and dollars. Listing tools record asking prices rather than completed sales.
Fortune’s model places the global lab-grown diamond market at $29.46 billion in 2025 and the U.S. portion at $6.59 billion. The same model assigns $10.17 billion to Asia Pacific, $8.61 billion to North America and $6.23 billion to Europe.[1] These are parts of one commercial model, not government totals.
Grand View’s model places the global synthetic diamond market at $12.07 billion in 2025.[2] Because both sources cover jewelry and industrial uses but publish different terminology, assumptions and forecast paths, one cannot be used to certify the other. The responsible answer is a range of published models with their boundaries, not a blended number.
Lab-grown diamond sales revenue can move differently from physical output. Sell more volume at a lower average value and revenue may rise slowly, stay flat or fall. A richer mix of larger or higher-value goods can push it the other way. Without an explicit volume series, a revenue forecast says nothing reliable about future carats.
For shoppers, market-size research is useful for understanding the category. It cannot price a specific diamond. That still depends on carat weight, cut, color, clarity, shape, grading documentation and the seller’s service package.
A market model begins with choices. Analysts decide which products and applications count, which prices represent value, how regional activity is allocated and how incomplete observations become estimates. They may use different base years, currencies, company samples and forecast assumptions.
The public Fortune and Grand View summaries do not disclose enough compatible methodological detail to identify one exact cause for the gap. The visible differences already matter. Fortune’s forecast runs through 2034 at 13.42%. Grand View’s runs through 2033 at 3.8%.[1][2] Each source is modeling a different path for the future.
Before comparing any market figures, match the geography, year, unit, application and price basis. Ask whether a value is observed, estimated or forecast. Then check whether the denominator is revenue, units, carats, rings, exports or survey respondents.
Treat market growth as context, not a quality grade. A larger forecast does not make one stone better, and a lower category price does not show whether two diamonds are comparable.
Do Amore’s lab-grown diamond search helps shoppers hold key variables constant, including shape, carat, cut, color, clarity, price and grading lab. Compare those fields first, then use market trends to understand the wider category. This keeps both optimistic forecasts and dramatic price headlines from making the decision for you.
Within Fortune’s 2025 model, Asia Pacific represents 34.54% of revenue and North America represents 29.23%. North America is modeled at $8.61 billion, including $6.59 billion for the United States.[1] These shares use Fortune’s modeled global revenue as the denominator.
For lab-grown diamond market share by size, the same source says stones up to 2 carats account for 70.07% of its 2025 market by size segment. HPHT leads its manufacturing-method segment. CVD carries the faster stated forecast CAGR of 13.85%. Industrial applications lead the model in 2025. Fashion applications have the faster stated forecast CAGR of 14.35%. The 2-to-4-carat segment has a forecast CAGR of 12.13%.[1]
Grand View reports a different segmentation. Colorless products account for more than 71% of its 2025 revenue, North America accounts for more than 32%, and jewelry and fashion hold the highest application revenue share. It forecasts a 4.3% CAGR for that application through 2033.[2]
None of these revenue shares equals unit sales, household ownership or the percentage of engagement rings with lab-grown centers. The denominator must travel with the percentage.
Regional shares require care. A region’s share of modeled revenue does not tell us what portion of residents bought a lab-grown diamond, how many stones were sold or whether jewelry led industrial demand there. It answers only how the research company divided the revenue in its own model. The same rule applies to product and manufacturing-method shares.
A polished gem in an engagement ring and synthetic diamond powder used as an abrasive share a carbon crystal structure, but they belong to different demand systems. Jewelry evidence is usually expressed as ring transactions, consumer survey responses, polished-gem exports or revenue. Industrial evidence is commonly expressed as carats of bort, grit, dust and powder, plus production value.
The U.S. Geological Survey estimates that U.S. manufacturers produced 160 million carats of industrial diamond bort, grit, dust and powder worth $52 million in 2025. It reports worldwide manufactured industrial diamond production above 15 billion carats and says synthetic material accounts for more than 99% of industrial diamond production and consumption.[3]
Those enormous carat totals do not describe gem-quality stones or engagement-ring demand. Comparing industrial carats directly with jewelry dollars would mix different materials, quality thresholds and end uses.
The strongest public U.S. evidence comes from datasets with different methods. BriteCo analyzes thousands of jewelry sales matched to appraisals and reports estimated sales prices separately from appraised replacement values. The Knot surveyed 10,474 U.S. couples who married in 2025 and were recruited through The Knot and WeddingWire.[4][5]
That distinction explains why their adoption shares need not match. BriteCo measures an appraisal-linked transaction dataset. The Knot measures self-reported choices among a defined group of couples. Neither represents total U.S. lab-grown diamond demand or every jewelry purchase.
Appraisal-linked data can capture detailed characteristics and price relationships, but it reflects items that enter that appraisal ecosystem. A wedding survey can capture motivations and stated choices, but it relies on respondent recall and the survey’s recruitment frame. Reading both offers a wider view, provided their percentages remain separate.
The date boundary matters too. BriteCo’s 51.0% figure stops in June 2026, so it is timely but not a full-year result.
The Knot’s results were published in 2026 but describe couples married in 2025. Publication year and data year are not interchangeable.
For shoppers ready to move from market data to individual designs, Do Amore’s lab-grown diamond engagement rings provide a relevant collection to compare after the evidence, not a substitute for it.
BriteCo’s series shows lab-grown engagement-ring share rising from 5.9% in 2019 to 18.7% in 2020, 27.4% in 2021, 33.9% in 2022, 39.0% in 2023, 42.5% in 2024 and 47.0% in 2025. For January through June 2026, the share is 51.0%.[4] That last figure is partial-year data, not a confirmed full-year result.
The center stones became larger in this dataset. In 2025, the median lab-grown center was 2.16 carats, compared with 1.52 carats for a natural center. For January through June 2026, the medians were 2.25 carats for lab-grown and 1.56 carats for natural.[4]
BriteCo’s price measures need equally careful labels. Its 2025 median sales-price estimate for a natural-diamond engagement ring was $12,961, compared with $4,557 for a lab-grown ring. For January through June 2026, the respective medians were $13,660 and $4,578.[4] These are finished-ring price estimates, not loose-stone quotations.
The Knot reports that 61% of engagement rings among its 2025 U.S. respondent group had a lab-grown center stone, a 239% increase from 2020. Forty percent of respondents said a lab-grown center was important to them.[5]
The study reports an average center stone of 1.9 carats overall and average engagement-ring spend of $4,600.[5] Because the public release does not display a complete origin-by-size table, this report does not repeat more detailed carat splits from secondary summaries.
The Knot’s 61% and BriteCo’s 47.0% for 2025 are not competing versions of one national census. They reflect different populations, collection methods and measurement frames. Averaging them would erase those differences.
A separate Plumb Club article reports 84% awareness of lab-grown diamonds among its surveyed consumers, with 65% willing to consider them for fashion jewelry and 74% open to a lab-grown engagement ring.[6] The public article does not expose the full sample-screen detail, so these figures are useful directional context, not a population-wide estimate.
Yes, several measured lab-grown diamond price series have declined. That does not mean every stone, size band, ring or geography moved by the same amount. Price per carat, finished-ring price, wholesale price, export value and listing price answer different questions.
BriteCo’s U.S. appraisal-linked data is the clearest source here for lab-grown diamond retail prices in engagement rings. GJEPC data describes India’s polished exports. Neither should be treated as a universal consumer price index.
Do Amore’s guide to lab-grown diamond prices can help shoppers translate broad trends into a like-for-like comparison of individual stones, reports and ring totals.
In BriteCo’s 2025 data, the median natural-diamond engagement ring sales-price estimate was $12,961 and the median lab-grown ring estimate was $4,557. On a per-carat basis, the respective medians were $8,428 and $2,057.[4] A finished ring includes the setting and design, so ring price and stone price per carat should remain separate.
The lab-grown median price per carat in the same series fell from $4,622 in 2019 to $2,057 in 2025, a reported decline of 55%. It was $2,015 for January through June 2026.[4] At the same time, the median lab-grown center in the dataset reached 2.16 carats in 2025 and 2.25 carats in the partial 2026 period.[4]
That combination helps explain how lower price per carat can coexist with larger chosen stones and higher adoption. It does not prove that all buyers spent less or that total demand collapsed.
The public datasets used here do not isolate why prices declined, so this report does not assign one cause. A lower current price says nothing certain about future resale value. The figures describe purchases rather than investment performance.
When comparing two rings, hold as many variables constant as possible. Match the center-stone shape, carat band, grading details, report type and setting. A broad median can orient your budget, but it cannot tell you whether two particular offers are equivalent.
Retail, appraisal, wholesale, export and listing prices sit at different points in the market. A retail transaction records what someone paid for a finished item or stone. An appraisal estimates replacement value for insurance. Wholesale prices apply between businesses, polished export values are recorded at a trade boundary, and listing prices show offers rather than completed transactions.
So falling export value alongside rising volume can show price compression within that trade series. It cannot prove weaker U.S. consumer demand, reveal retailer margins or tell us the exact price a shopper paid.
Time periods must match as well. India’s fiscal year runs across parts of two calendar years. BriteCo reports calendar years and a six-month 2026 interval. A year-over-year fiscal trade change cannot be laid directly over a U.S. calendar-year ring series as if both covered the same months.
GJEPC reports $1.13 billion in polished lab-grown diamond exports for India’s FY2025-26, down 10.55% year over year as exported volume increased. In the same fiscal year, exports of gold jewelry studded with lab-grown diamonds rose 31.30% to $1,425.51 million from $1,085.65 million.[7]
Polished stones and finished gold jewelry set with lab-grown diamonds are separate categories. They can move in opposite directions because their product mix, prices and demand channels differ.
Longer-run context matters. GJEPC’s annual report shows polished lab-grown exports growing from $63.5 million in FY2015-16 to $1,267.28 million in FY2024-25, more than a twentyfold increase. The FY2024-25 value was nevertheless 9.64% below $1,402.44 million in FY2023-24.[8]
The pattern is growth over a decade alongside a recent value correction. It is not evidence that every producer, market or retail category followed the same path.
Export value can fall as average declared value, product mix, destinations or contract terms change. Rising volume shows that more physical goods moved in this series. The public release still lacks enough compatible detail to calculate a universal price per carat, so this report does not attempt one.
The growth of studded gold-jewelry exports shows how value can migrate along the supply chain. More value in a finished-jewelry category does not cancel a decline in polished-stone exports because the products include different inputs and levels of manufacturing.
Lab-grown diamonds are crystals made in controlled manufacturing environments, principally through chemical vapor deposition, or CVD, and high pressure high temperature, or HPHT. They are not the same as diamond simulants such as cubic zirconia. GIA documents both growth methods in its laboratory research.[9]
The Federal Trade Commission says marketers should use a clear qualifier such as “laboratory-grown” or “laboratory-created” immediately before “diamond,” with equal conspicuousness, when the product is not mined. The guidance applies the term diamond when the laboratory-grown product has essentially the same optical, physical and chemical properties as a mined diamond.[10]
Quality still varies from stone to stone. When comparing lab-grown and natural diamonds, consider cut, color, clarity, carat weight, treatments, origin disclosure and the grading report rather than using growth method alone as a shortcut.
HPHT recreates high-pressure, high-temperature conditions in which carbon crystallizes around a seed. CVD uses a carbon-containing gas in a low-pressure chamber, depositing carbon onto a diamond seed in layers. Both can produce gem-quality diamond.
Growth method can leave different identifying features that a gemological laboratory detects with specialized instruments. Those origin features are not the same as the familiar 4Cs. Two stones grown by the same method can still differ widely in cut, color, clarity and appearance, as two mined diamonds can.
The distinction between treatment and origin matters. Post-growth treatment may alter color, but it does not change a laboratory-grown stone into a mined stone or a simulant. A complete report should disclose the origin and any detected treatments according to the laboratory’s format.
GIA reports that CVD now dominates the laboratory-grown stones submitted to its laboratories and that about 80% of its CVD submissions receive post-growth HPHT treatment. That is a GIA submission pattern, not a global production share.[9]
Neither CVD, HPHT nor post-growth treatment alone determines beauty or value. A buyer should compare the complete report and the stone’s visible performance. Do Amore’s diamond grading guide explains how the relevant fields support that comparison.
GIA’s submission data shows how manufacturing capability has changed. More than 90% of HPHT-grown diamonds submitted from 2021 through 2023 were colorless. The article notes that only about 1% of natural diamonds are Type II, a category that includes many colorless HPHT-grown diamonds.[9]
In the early 2000s, most CVD submissions to GIA were under 0.5 carat. The majority now exceed 3 carats. Most HPHT submissions began exceeding 2 carats in 2016.[9] Again, these are submission patterns, not estimates of all world output.
A 75.33-carat CVD-grown diamond described by GIA set a laboratory record, compared with a 16.41-carat CVD record reported in January 2022.[9] Record stones show technical capability, not what a typical shopper should expect in a ring.
USGS’s industrial data covers bort, grit, dust and powder used in cutting, grinding, polishing, thermal and technical applications. It does not measure gem-quality engagement rings.
For 2025, USGS estimates U.S. manufactured industrial diamond production at 160 million carats with a value of $52 million. Worldwide production exceeded 15 billion carats, and synthetic material represented more than 99% of industrial production and consumption.[3]
Those statistics are important to the broader synthetic diamond industry, but they should never be compared directly with consumer ring prices or polished export values. The unit “carat” does not create a common market when the material and application differ.
Industrial demand still shapes technology, capacity and the broader synthetic diamond sector. Consumer analysis adds gem quality, cutting yield, grading and jewelry design, none of which industrial production totals capture. Keeping the streams separate prevents a huge volume figure from giving shoppers the wrong picture of jewelry supply.
No. Price by itself does not determine a lab-grown diamond’s quality. Cut, color, clarity, carat weight, visible performance and grading details still belong in the comparison.
Do Amore sells both lab-grown and natural diamonds, so its guidance treats origin as a choice rather than a quality shortcut. Compare the full report and the stone you can see, then decide which balance of size, quality, price and origin fits your priorities.
Grading language is changing with the market. GIA announced that, from October 1, 2025, its service for colorless-to-near-colorless laboratory-grown diamonds would use the descriptive categories Premium and Standard rather than the nomenclature used for natural diamonds.[11]
For Premium, GIA requires D color, VVS clarity or higher, excellent polish and symmetry, plus excellent cut for round brilliants. Standard has minimum thresholds of E through J color, VS clarity, very good polish and symmetry, with Good symmetry permitted for fancy shapes, plus very good cut for round brilliants. Stones below the Standard thresholds do not receive the assessment.[11]
The service change introduces new labels without making older market values comparable or prices predictable. Report type and issue date now matter even more.
FTC disclosure rules remain a separate issue from quality grading. A seller must make the laboratory-grown origin clear and must not describe a genuine lab-grown diamond as a simulant.[10] Origin language tells you how the stone was made. Grading details describe its characteristics.
Market headlines can help frame a decision, but they cannot choose a stone for you.
What is your total ring budget? Which visible size feels right? Which quality differences can you see or value? What report and return protections come with the purchase?
Those four answers make broad market trends practical. Choose a budget and preferred visible size, then compare grading details, measurements, treatment disclosures and videos within the same price range.
Do Amore’s searchable lab-grown diamonds let you move from broad market trends to individual stones with their own characteristics and reports.
Keep the stone price separate from the finished-ring total. A lower price per carat can make room for a larger center, a different setting or another priority, but the best balance depends on what matters to you.
Use the natural-versus-lab guide when you want a neutral comparison of origin, availability, price and personal preferences. Market growth does not make either origin universally better.
Ask what every statistic measures. Forecasts are projections, export values are not U.S. retail prices, appraisal-linked shares do not represent a national census, and industrial carats belong to a different market than jewelry carats.
After the product education, shoppers who care about the purpose connected to a purchase can review Do Amore’s clean-water impact. That program is first-party information about Do Amore, not evidence about the size or environmental effect of the lab-grown diamond market.
These answers keep every figure tied to its source, period, and method.
Yes, several measured series show declines, but no single percentage applies to every lab-grown diamond. BriteCo reports that median price per carat in its U.S. appraisal-linked engagement-ring data fell 55% from $4,622 in 2019 to $2,057 in 2025, then measured $2,015 for January through June 2026.[4]
GJEPC reports a different measure. India’s polished lab-grown export value fell 10.55% in FY2025-26 as volume rose.[7] Size, quality, geography and market level all matter, so retail, wholesale and export trends should not be treated as interchangeable.
No official single total exists. Fortune values its global market model at $29.46 billion for 2025 and estimates $33.54 billion for 2026. Grand View values its model at $12.07 billion for 2025 and estimates $12.6 billion for 2026.[1][2]
Both are global dollar models that cover jewelry and industrial applications, but their public methods and definitions are not compatible enough to combine. The 2026 figures are estimates, not confirmed results.
No. Adoption is high in some U.S. engagement-ring datasets, but those samples do not represent all shoppers, countries or jewelry categories.
The Knot reports a 61% lab-grown center-stone share among 10,474 U.S. couples married in 2025.[5] BriteCo reports 47.0% in its 2025 appraisal-linked ring data and 51.0% for January through June 2026.[4] A survey share and an appraisal-linked share can differ because they measure different populations.
The answer depends on the dataset. The Knot’s self-reported study of 10,474 U.S. couples married in 2025 found a 61% share.[5] BriteCo’s appraisal-linked data found 47.0% in 2025 and 51.0% in the first six months of 2026.[4]
Do not average these percentages. Their respondent groups, collection methods and periods differ, so each is best read within its own frame.
Published models point to growth, several U.S. engagement-ring datasets show strong adoption, and specific retail and export series record lower prices. The size of the category still changes with what each source counts.
Keep those boundaries in view, then compare current stones and settings against your budget, size and quality priorities. Do Amore makes that next step concrete without asking you to treat a forecast as a promise.
Its lab-grown search lets you save and compare individual stones by shape, carat, cut, color, clarity, price and grading lab. Each Do Amore purchase gives one person access to clean water.
Review the options side by side, save the ones that fit and choose only when the stone, ring and meaning feel right.