













Your bag is empty
Explore timeless jewelry that carries love and inspires lasting impact.
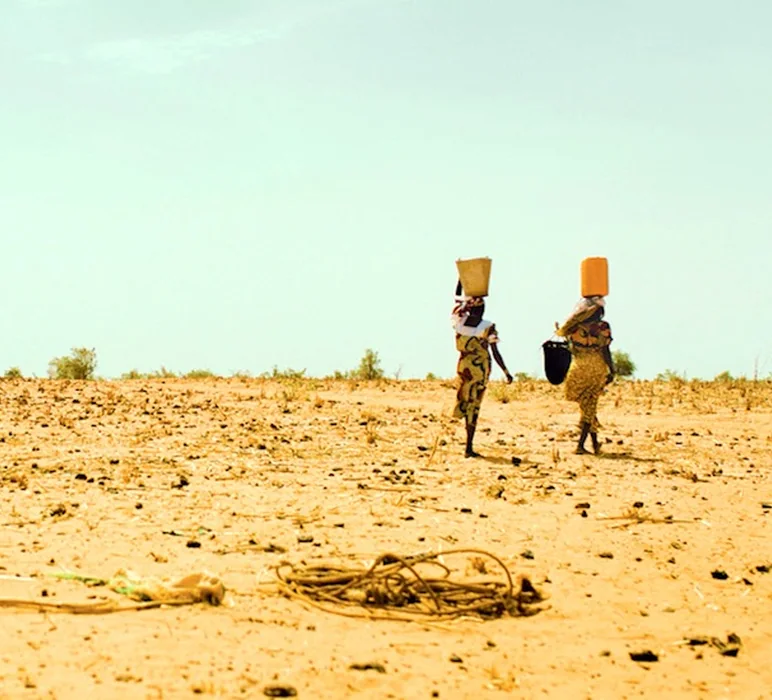
We promise that every purchase you make gives one person access to clean, life-changing water.
Explore timeless jewelry that carries love and inspires lasting impact.
Diamond mining environmental impact statistics do not point to one universal footprint. Energy sources, mine design, ore grade, climate, water availability, waste management and the boundary used in a study can all change the result. A figure for one large open-pit mine cannot describe every underground, marine or artisanal operation.
These diamond mining environmental impact statistics bring together the most defensible public evidence available for a 2026 reader. The underlying data come from different years, mainly 2016 through 2025. Each figure is labeled by data year and scope so that an older baseline is not mistaken for a 2026 measurement.
| Statistic | What it measures | Year + source |
| 160 kg CO2e | Estimated emissions per polished carat in the DPA member study | 2016 data | Trucost, 2019 report |
| 7.3 m³ | Water depletion per polished carat; not water withdrawal | 2016 data | Trucost, 2019 report |
| 4,350 kg | Waste rock per polished carat; separate from industrial waste | 2016 data | Trucost, 2019 report |
| 1.86 kg | Industrial waste per polished carat | 2016 data | Trucost, 2019 report |
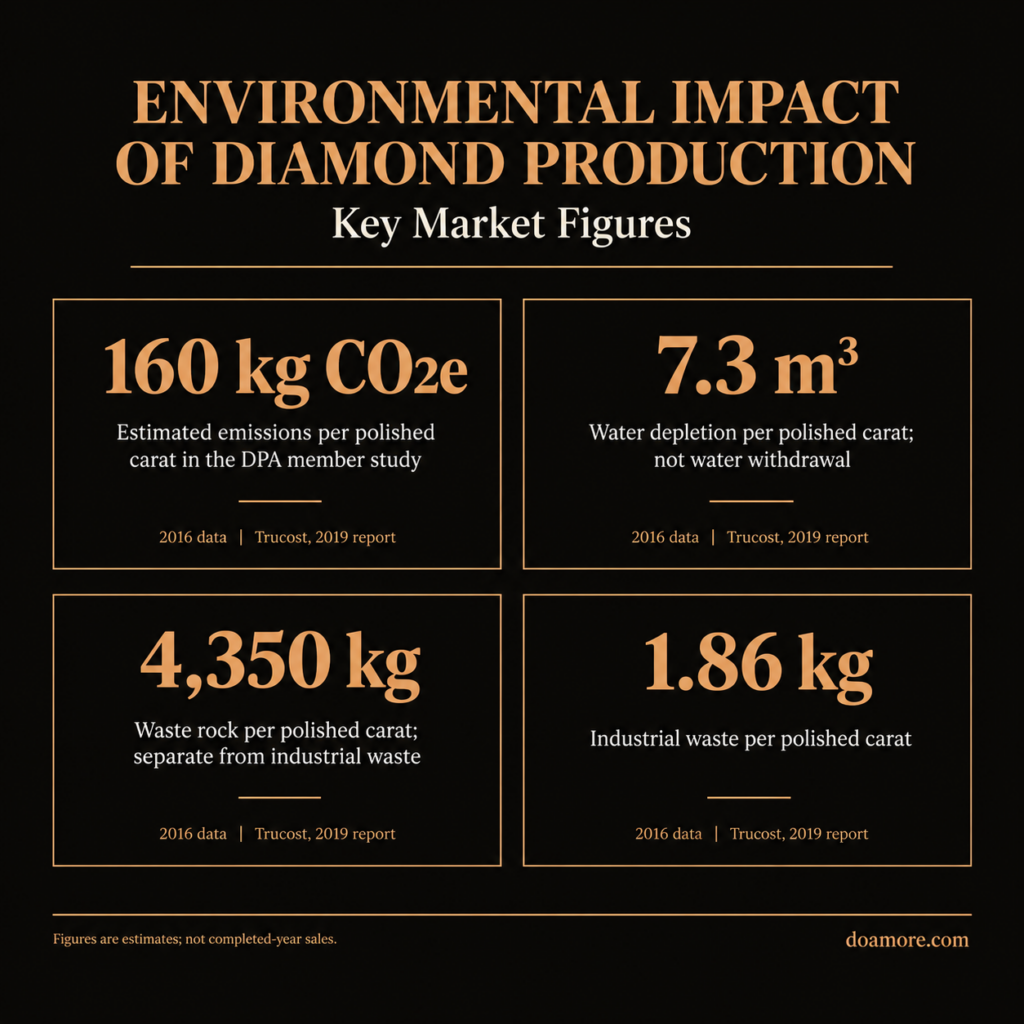
The strongest broad benchmark is a 2019 S&P Global Trucost study using 2016 data from large-scale producers. It covered four companies and six countries in its operational sample, included open-cut, underground, alluvial and marine mining, and represented 70% of the participating members’ rough production. (S&P Global Trucost)
The study was commissioned by the Diamond Producers Association and relied partly on member-supplied data, modeling and extrapolation, so it is useful as a baseline rather than a complete industry average. (S&P Global Trucost)
The remaining sources answer narrower questions. A peer-reviewed paper modeled artisanal and small-scale alluvial mining in the Democratic Republic of the Congo. (Galli et al.) A Chalmers screening life-cycle assessment estimated global health and environmental burdens. (Furberg et al.)
A 2025 peer-reviewed experiment focused on carbon mineralization in residue from a single Canadian open-pit mine. (McDonald et al.) De Beers disclosures provide 2025 results for one producer. (De Beers) Canadian government data cover regulated metal and diamond mine effluent in 2023. (Environment and Climate Change Canada) (McDonald et al.)
A carat is a unit of diamond weight, not a measure of environmental performance. Per-carat intensity can make mines with different output volumes easier to compare, but it can move sharply when ore grade or recovery changes.
A mine can reduce its annual emissions even as its emissions per carat rise, or produce more diamonds and improve its intensity. Both the annual total and the denominator are necessary.
The year beside a statistic matters too. “Statistics 2026” describes the publication context of this page. It does not turn a 2016 baseline, a 2023 government report or a 2025 company result into 2026 operational data. For broader market context, Do Amore’s jewelry statistics page separates publication timing from the years represented in each dataset.
A rough carat is diamond weight before cutting and polishing. A polished carat is the finished weight after some material has been removed.
The Trucost report normalized most results per polished carat, though the sampled mine data represented 70% of participating companies’ rough output. It reported 160 kg CO2e per polished carat and provided a rough-carat equivalent of 56 kg CO2e. (S&P Global Trucost)
That conversion belongs to the report’s model. It should not be applied automatically to another mine, country or year. Results per rough-output carat, polished-output carat, tonne of ore or tonne of residue answer different questions.
Industrial diamonds used in tools differ from gem-quality diamonds used in jewelry, even when a study groups natural diamond production together.
Open-pit mining moves overburden and rock at the surface. Underground mining can require extensive ventilation, pumping and hoisting. Alluvial mining works sediments deposited by water. Marine mining uses vessels and seabed-recovery systems. These methods have different energy, land, water and residue profiles.
Location changes the result as well. A mine using a carbon-intensive electricity grid may have higher Scope 2 emissions than one supplied by lower-carbon power. A water withdrawal may be more consequential in a dry basin than a larger volume in a water-abundant region. Rehabilitation depends on climate, soil, ecology and the final land-use plan.
Then check the system boundary. Direct mine fuel combustion belongs to Scope 1. Purchased electricity belongs to Scope 2. Relevant value-chain emissions, such as some purchased goods and downstream activities, may fall under Scope 3. A mine-gate study is not a full life-cycle assessment of cutting, polishing, jewelry manufacturing, transport, retail or use.
Ask for the claim’s source, date, denominator and boundary before treating it as meaningful. Do Amore’s published sourcing approach gives buyers a place to review how the company describes its natural, recycled and lab-grown options.
That first-party disclosure can guide follow-up questions, but it does not replace independent mine or facility data. Ask where a stone came from, which chain-of-custody record applies and whether an environmental figure covers mining, production or a full life cycle.
Carbon emissions and energy use vary with equipment fuel, electricity source and operational boundary, so no single mine or company result can stand for the entire sector. (S&P Global Trucost)
For the participating large-scale producers, Trucost estimated average greenhouse gas emissions of 160 kg CO2e per polished carat in 2016. The report expressed the result as 56 kg CO2e per rough carat. Its operational scope covered member mines and centralized support services rather than every stage from mine to finished jewelry. (S&P Global Trucost)
Energy use drove the result. Trucost attributed 42% of the climate impact to fossil fuels used in machinery and 58% to electricity consumption. (S&P Global Trucost) Those percentages explain why there is no stable emissions number for every natural diamond. Haul distance, depth, ventilation, pumping, ore grade, equipment efficiency and grid composition can all alter the total.
The same report quantified other emissions per polished carat. Its modeled averages were 0.40 kg of particulate matter, 0.86 kg of nitrogen oxides, 0.51 kg of sulfur dioxide, less than 0.01 kg of ammonia, 0.13 kg of non-methane volatile organic compounds and 0.04 kg of phosphorus. (S&P Global Trucost)
These are modeled average outputs for the participating large-scale operations in 2016. They should not be read as a forecast or as measured concentrations at every site.
Company reporting can show direction of travel, but it does not replace a comparable industry dataset. De Beers reported a 14% reduction in Scope 1 and 2 carbon emissions from its 2021 baseline through 2025. (De Beers)
It described its support for a 520 MW renewable-energy project in Southern Africa. (De Beers) These statements are current company disclosures. They do not establish the performance of other producers or show the footprint of an individual diamond.
A 2020 Chalmers screening life-cycle assessment reached a related but broader conclusion. In its model, electricity use in large-scale mining and processing dominated the environmental results. The study used a global-average perspective and disability-adjusted life years for health analysis. (Furberg et al.)
It estimated about 1.3 life days lost per natural-diamond carat and about 490,000 life years across 134 million carats of 2016 production. It attributed 97% of its modeled health impact to occupational accidents in artisanal mining. (Furberg et al.)
Those health estimates are modeled screening results, not a count of observed injuries at every mine. The authors identified uncertainty in inputs such as the number of artisanal miners and the fatal-accident rate.
They estimated that about one-fifth of global diamond production came from artisanal mining. (Furberg et al.) The study is most helpful as a warning about where better data are needed, not as a precise score for a specific stone.
“Water use” can hide several different measures. Withdrawal is water taken from a source. Consumption is the portion not returned to the same basin in a usable form. Discharge is water released after use or treatment, and recycled or reused water circulates within an operation.
Water depletion is another modeled concept, sometimes adjusted for local scarcity, so a recycling percentage cannot be compared directly with cubic meters of depletion.
Trucost estimated water depletion of 7.3 cubic meters per polished carat for participating large-scale operations in 2016. (S&P Global Trucost) The denominator is polished output, and the result is a modeled average across several companies, countries and mine methods. It does not mean that every mine withdrew or consumed exactly that volume.
The same study valued air, land and water pollution at 6% of the participating producers’ total monetized impacts. (S&P Global Trucost) That percentage describes a share of the study’s natural and social capital valuation, not a physical share of pollution and not a compliance rate.
Galli and colleagues used mapped mine areas, land-use data and a spatial agro-hydrological model to study the DRC from 2001 to 2018. For the water series, the paper modeled a constant footprint of 13.9 cubic meters per rough carat, then combined it with national production. (Galli et al.)
Estimated diamond-mining water demand declined from 0.419 cubic kilometers in 2004 to 0.229 cubic kilometers in 2018 as reported production fell. (Galli et al.)
The paper described the modeled diamond-mining water footprint as about 25 times nationwide irrigation. (Galli et al.) That comparison is specific to the DRC data and modeling choices.
The 13.9-cubic-meter factor was not measured separately at every artisanal site. The researchers worked with incomplete mine-activity records, so their analysis used scenarios rather than claiming exact coverage of all mining. (Galli et al.)
Local consequence depends on timing and access. The authors concluded that the national volume was not a risk to the DRC’s overall renewable freshwater resource, but that consumption could still be significant in and downstream of mining areas where water access and infrastructure were constrained. (Galli et al.) National abundance can coexist with local scarcity.
Waste numbers are easy to blur together, so the labels matter. Waste rock is material moved to reach or process ore. Tailings are finer residues left after mineral processing.
Processed kimberlite may include coarse and fine fractions. Industrial waste covers different materials again, including oils, packaging and scrap. Rolling these categories into one total can hide very different management needs.
In the Trucost 2016 baseline, participating operations generated an average 4,350 kg of waste rock per polished carat and 1.86 kg of industrial waste per polished carat. Of the industrial waste, 26%, or about 0.5 kg per polished carat as the report rounded it, was recycled. (S&P Global Trucost)
The reported waste mass was more than 99% waste rock, based on the two per-carat figures. The calculation is straightforward. Dividing 4,350 kg by 4,351.86 kg gives about 99.96%. It should not be interpreted as a universal waste composition for all mines. Ore grade, mine plan and the classification of residues can change the ratio. (S&P Global Trucost)
A buyer comparing recycled and newly mined diamonds should keep the system boundary visible. Reusing an existing diamond avoids a new demand signal for extraction, but refurbishment, grading, setting and transport can still have impacts.
A newly mined diamond carries mine-stage effects that a recycled stone does not repeat. That does not make a single per-carat mine figure a complete life-cycle comparison.
A 2025 peer-reviewed study tested fine processed kimberlite from the Gahcho Kué open-pit mine in Canada. Laboratory batch leaches indicated a potential to bind 12 kg of CO2 per tonne of residue based on readily extractable elements.
A 40-day post-deposition field assessment measured 0.86 kg CO2 per tonne when residue dried through an optimal 30% to 40% water-saturation range. Year-long weathering columns measured 0.63 kg CO2 per tonne per year. (McDonald et al.)
The researchers modeled the year-long rate against mine planning data and estimated that passive carbonation could offset about 7% of the mine’s life-of-mine CO2e emissions by 2030. (McDonald et al.)
Their scenario assumed each tonne of residue would continue to sequester at the measured annual column rate as residue accumulated. (McDonald et al.) This is a mine-specific projection under defined storage conditions, not a verified offset for all kimberlite waste.
Planning data cited in the paper anticipated 15.5 million tonnes of fine processed kimberlite by closure, about 35% of 44.5 million tonnes of total processed kimberlite. (McDonald et al.)
It estimated 1.34 million tonnes CO2e across the mine life through 2030. (McDonald et al.) The difference between the laboratory potential, the 40-day field result and the one-year column rate shows why “carbon-storing mine waste” needs a method and a time horizon attached.
Land figures are as sensitive to definitions as water figures. A mine’s operating area may include pits, roads, plants, accommodation and residue facilities. A conservation area may be off-site or managed through a partnership. Rehabilitation refers to work on disturbed land. These categories should not be netted into a single “positive” land balance.
The Trucost baseline reported 84,077 hectares used by participating large-scale mining operations in 2016. It reported 263,626 hectares protected, more than 1,000 square miles and roughly three times the operational area. On a polished-output basis, the report expressed these as 272 square feet used for operations and 854 square feet protected per polished carat. (S&P Global Trucost)
These figures do not mean every hectare disturbed was restored. Protection elsewhere can support biodiversity, but it does not erase habitat conversion, fragmentation, dust, noise or changed drainage at a mine site. The data came from participating large-scale producers, not the entire natural-diamond sector.
De Beers reported managing more than 375,000 acres of conservation land in 2025 and said it was actively managing three times more land for nature than it had disturbed. (De Beers) That is first-party, company-specific reporting.
It offers useful current context, but independent site-level evidence is still needed to judge ecological condition, additionality and long-term outcomes.
Open-pit mines typically create an obvious surface footprint and large rock-moving requirements. Underground mines may disturb less surface area for the workings but still need portals, shafts, waste facilities and energy-intensive ventilation.
Alluvial operations can affect riverbanks, floodplains and sediment movement. Marine operations shift the question to seabed disturbance and recovery.
A single area-per-carat number cannot resolve these differences. Land impact is better assessed with mapped disturbance, habitat type, ecological condition, rehabilitation progress and the duration of change. Carats provide an output denominator, not an ecological quality measure.
Rehabilitation begins with a credible closure plan, financial provision, progressive work where feasible and measurable completion criteria.
It can include reshaping landforms, stabilizing waste, replacing soil, restoring drainage, re-establishing vegetation and monitoring water and habitat. “Rehabilitated” should not be used for land that has only been seeded or scheduled for later work.
Canadian regulation provides one view of ongoing water controls. In 2023, 147 metal mines and four diamond mines, 151 facilities in total, were subject to federal Metal and Diamond Mining Effluent Regulations. A mine entered the reporting scope when effluent flow exceeded 50 cubic meters per day and it deposited a regulated deleterious substance. (Environment and Climate Change Canada)
The government report combined metal and diamond mines for most performance results, so those totals are not diamond-only statistics. Regulated effluent had to remain between pH 6.0 and 9.5, stay within concentration limits and not be acutely lethal. (Environment and Climate Change Canada)
Operators typically tested deleterious substances weekly and acute lethality monthly, with reduced-frequency provisions after specified periods of strong performance. (Environment and Climate Change Canada)
Across the combined regulated population, operators conducted 1,417 fish acute-lethality tests in 2023. Twenty-one tests at 10 mines produced greater than 50% fish mortality. (Environment and Climate Change Canada)
They conducted 1,894 invertebrate tests, with 78 results at 24 mines above the same mortality threshold. The report recorded 136 exceedances for deleterious substances and pH, down from 181 in 2022. (Environment and Climate Change Canada)
Four waters or places were newly listed in 2023 as tailings impoundment areas under Schedule 2. (Environment and Climate Change Canada) Because the report covers metal and diamond mines together, it cannot show whether those additions or most exceedances came from diamond facilities. It does show why closure claims require continuing, site-specific water and waste evidence.
The Gahcho Kué residue study illustrates the difference between research potential and closure performance. Its 12 kg CO2-per-tonne batch potential, 0.86 kg short-term field result and 0.63 kg annual column result were experiments. (McDonald et al.) They may inform residue management, but they do not prove that a whole site has been rehabilitated or that every tonne will behave the same way for decades.
Treat a give-back promise as a separate claim from the environmental footprint of a stone. Do Amore’s impact tracking page states that every purchase funds clean water access for one person and provides project updates, including the well’s GPS coordinates.
This does not change a diamond’s mining emissions, water use or waste, but it shows the kind of traceable evidence a buyer can ask any brand to provide.
There is no responsible universal answer to whether natural or lab-grown diamonds are always environmentally better. Natural-diamond results vary by mine method, ore grade, equipment and grid.
Lab-grown results vary by chemical vapor deposition or high-pressure, high-temperature production, electricity source, yield, facility efficiency and whether the study includes equipment, gases and post-growth processing.
A fair comparison needs the same functional unit and system boundary. Compare mine-gate natural data with a cradle-to-gate lab estimate only after aligning both boundaries.
Rough carats should not be set against polished carats. Annual corporate emissions should not be divided by output from a different year. Company marketing claims should not be treated as independent life-cycle evidence.
The 2019 Trucost report included a natural-versus-lab comparison, but this page does not use it. The report was commissioned by an industry association, and the compared datasets did not provide a sufficiently stable basis for a universal consumer conclusion.
Readers considering lab-grown diamonds should look for facility-specific energy data, the electricity mix, growth method, yield and a clearly stated boundary.
Start with the source, year and denominator. Ask whether a number describes one mine, one company, a national model or a multi-producer average. Look for direct measurements versus estimates, models and projections. A polished-carat intensity from 2016 may be informative, but it should not be presented as a current result for an unnamed stone.
Next, ask what is missing. Mine-stage carbon data may exclude cutting and polishing. Water withdrawal does not equal consumption. Conservation acreage does not equal rehabilitation. Waste rock should not be confused with industrial waste or tailings. A Scope 1 and 2 target does not include every Scope 3 activity.
For natural diamonds, origin and supplier documentation can narrow uncertainty, but traceability alone does not prove low environmental impact. For lab-grown diamonds, facility and power information matter because electricity can dominate production impacts.
Do Amore offers both natural diamonds and lab-grown diamonds, so the useful question is not which category wins automatically. It is which evidence applies to the specific option you are considering.
Do Amore’s sourcing approach explains the company’s first-party standards and options. That page should be read as brand information. The independent and institutional sources here support the environmental statistics. Both ideas can sit together. Jewelry can carry meaning, and its material history deserves clear questions.
These answers keep each figure tied to its source year, sample and denominator, so comparisons remain inside their stated boundaries.
The best broad figure in this review is the Trucost estimate of 160 kg CO2e per polished carat for participating large-scale producers in 2016, with a reported equivalent of 56 kg CO2e per rough carat. (S&P Global Trucost) It is not a universal 2026 rate. Mine type, ore grade, fuel, electricity and the rough-versus-polished denominator can materially change the result.
There is no single water-use number. Trucost estimated 7.3 cubic meters of water depletion per polished carat for its 2016 large-scale sample. (S&P Global Trucost) A separate DRC study modeled 13.9 cubic meters per rough carat for artisanal and small-scale alluvial production and estimated 0.229 cubic kilometers of national diamond-mining demand in 2018. (Galli et al.) Different concepts, geographies and denominators make direct comparison misleading.
For the 2016 Trucost sample, the modeled averages were 4,350 kg of waste rock and 1.86 kg of industrial waste per polished carat. About 26% of the industrial waste, roughly 0.5 kg per polished carat in the report, was recycled. (S&P Global Trucost) The result does not include one universal tailings figure and should not be transferred to every mine.
Closure work can stabilize land, restore vegetation and drainage, manage water and support new land uses, but “fully rehabilitated” needs site-specific completion criteria and long-term evidence.
Protected land outside a footprint is not the same as restored mine land. Government effluent rules and post-closure monitoring remain important because water and waste facilities can require care after production ends.
No universal claim is supported. Lab-grown production can avoid mine disturbance, but its emissions can depend heavily on electricity source, growth method, equipment and yield.
Natural-diamond impacts vary by mine and recovery method. Compare the same carat basis, data year, geography and life-cycle boundary, and prefer independently reviewed facility-level evidence over category-wide slogans.
These diamond mining environmental impact statistics are most useful when they make a claim narrower, not louder. The evidence here shows substantial energy, water, waste and land considerations, and it shows wide differences between mine types and studies.
Older baselines remain informative when their year is visible. Current company progress remains limited to the reporting company without independent evidence supporting a broader conclusion.
Do Amore offers natural and lab-grown paths, so you can carry the same evidence standard into the ring search without being pushed toward a category label. Use the source, year and boundary questions above to narrow your options, then choose the stone and design that match your priorities.
When you are ready to explore engagement rings, compare options with the same discipline. Ask where the evidence begins and ends, keep natural and lab-grown choices on equal methodological footing, and choose the combination of design, documentation and values that feels right for you.