




Your bag is empty
Explore timeless jewelry that carries love and inspires lasting impact.
We promise that every purchase you make gives one person access to clean, life-changing water.
Explore timeless jewelry that carries love and inspires lasting impact.
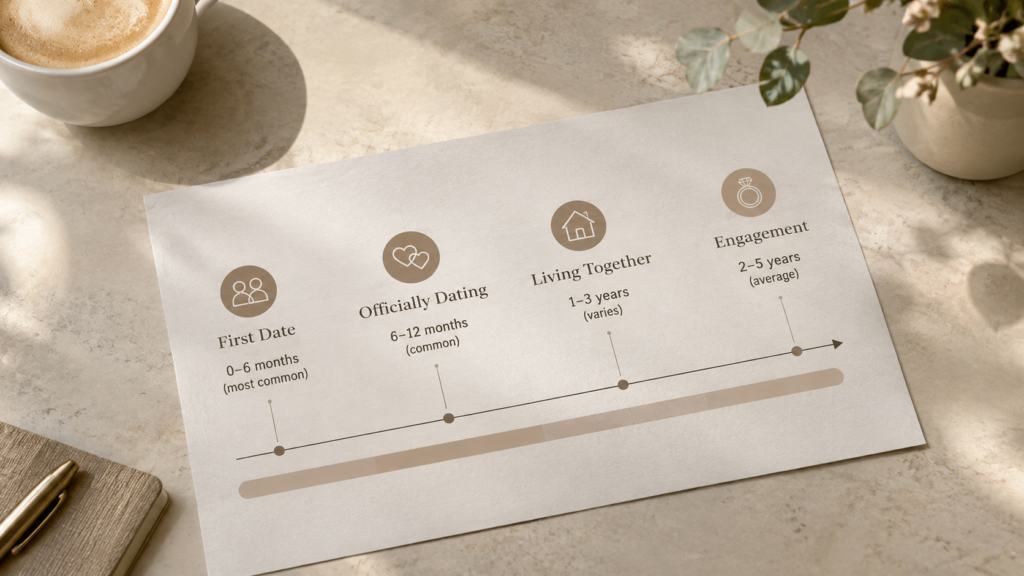
Statistics on the average time couples date before engagement do not point to a single relationship clock. U.S. couples who married in 2025 reported an average of 3 years from dating to engagement, and a 2024 UK survey of engaged couples reported a 4.7-year average. Those figures describe different countries, populations, and survey designs, so they should not be merged into a global average. (The Knot 2026 study) (Bridebook engagement survey)
This page brings together findings from original surveys and publisher reports. Each finding is labeled with its actual data year. The 2026 in the title is the publication context, not a claim that every survey was conducted in 2026.
| Statistic | What it measures | Year + source |
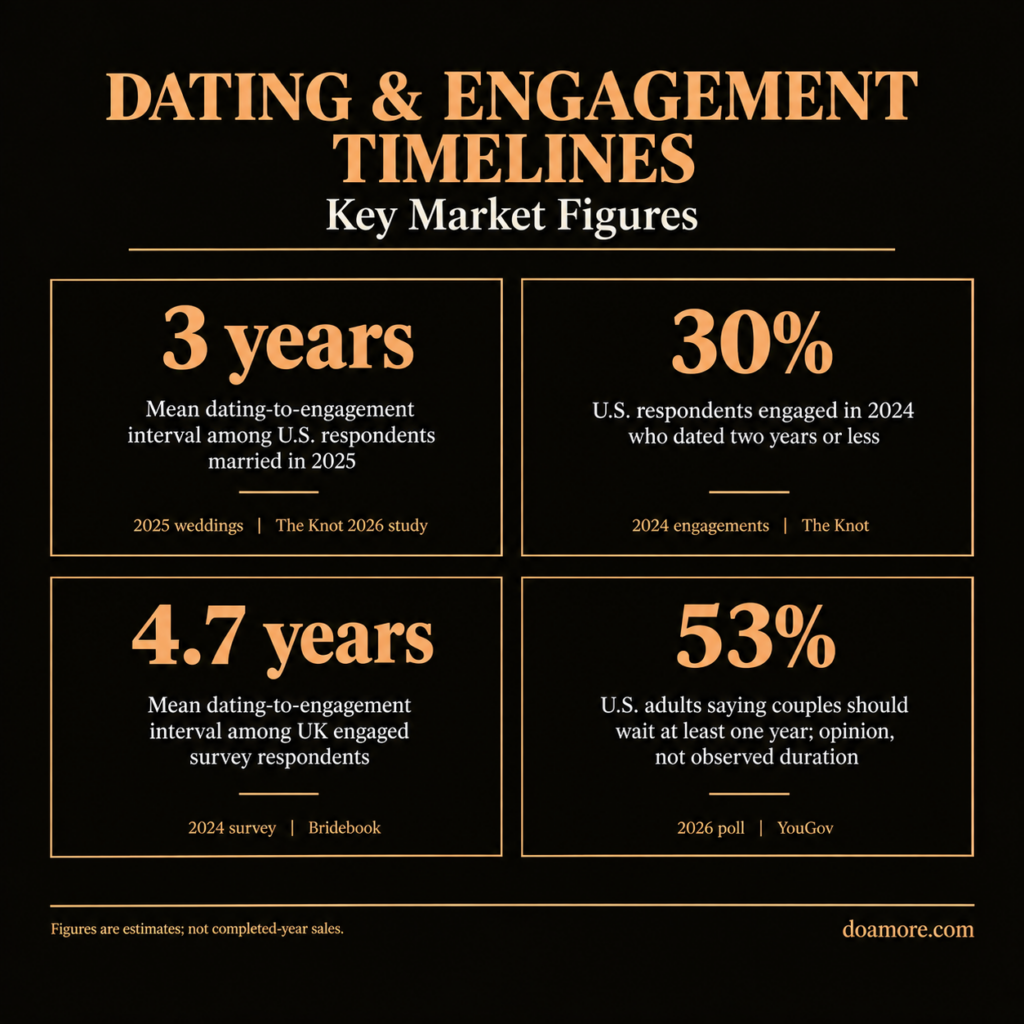
| 3 years | Mean dating-to-engagement interval among U.S. respondents married in 2025 | 2025 weddings | The Knot 2026 study |
| 30% | U.S. respondents engaged in 2024 who dated two years or less | 2024 engagements | The Knot |
| 4.7 years | Mean dating-to-engagement interval among UK engaged survey respondents | 2024 survey | Bridebook |
| 53% | U.S. adults saying couples should wait at least one year; opinion, not observed duration | 2026 poll | YouGov |
Three time periods often get mixed together in articles about relationship timing. Dating-to-engagement runs from the start of the relationship to the engagement. Engagement-to-marriage begins with the engagement and ends with the wedding. Total relationship duration before marriage can include both periods, and may include time before a couple began living together.
The type of statistic matters too. A mean is the arithmetic average. A median is the middle value when observations are ordered. A response category reports the share of people who selected a defined range, such as two to five years. A category cannot be treated as a mean or median, and separate intervals should not be added only when the source says they form a total.
The surveys below include platform-member samples, opt-in polling panels, and self-reported answers. They offer useful benchmarks for the populations surveyed, but they do not identify the best time to get engaged or predict whether a relationship will succeed.
Publication year and data year answer different questions. The Knot’s report labeled 2026 looks back at couples who married in 2025 (The Knot 2026 study). Bridebook’s 2024 report covers engaged couples planning weddings for 2024 and beyond (Bridebook engagement survey). A reader who sees only the article title could easily mistake both for surveys fielded in 2026.
Keeping the year beside each number prevents false recency. It makes changes in population visible. Someone surveyed after marriage may describe a completed courtship differently from someone who has recently become engaged. An opinion poll of all adults includes people who are single, partnered, married, or divorced.
The two headline averages on this page are means. They summarize responses within their respective samples, but they do not show the most common answer or the midpoint couple. Without a published distribution, a mean can hide short and long courtships at either end.
The 2024 U.S. study offers a different view because it reports ranges. Its 53% middle category shows that two to five years was the largest band (The Knot dating survey). It cannot tell us how many respondents dated for three years, four years, or any other single duration inside that band.
Opinion questions require another label. When 53% of U.S. adults said couples should wait at least a year in 2026 (YouGov 2026 survey), they were describing a preferred minimum. That result cannot be used to estimate what share of couples waited a year.
The newest U.S. evidence in this review comes from two proprietary studies with different populations. The Knot Real Weddings Study looked backward at people who married in 2025. Its Jewelry and Engagement Study surveyed people who became engaged during 2024. (The Knot 2026 study) (The Knot dating survey)
One study publishes a mean. The other uses three grouped response categories. Together they show that multi-year courtships were common among respondents, but the grouped data cannot be used to calculate a precise average.
U.S. couples who married in 2025 reported an average of 3 years of dating before engagement (The Knot 2026 study). The number is a mean for this sample, not a median and not a recommendation.
The study captured 10,474 responses from U.S. couples who married between January 1 and December 31, 2025. Respondents were recruited by email from The Knot and WeddingWire membership during 2025 (The Knot 2026 study). That makes it a large national platform sample, though it is not a probability sample of every couple who married in the United States.
The same 2025 sample found that 70% of couples lived together before engagement. Another 57% discussed marriage or engagement more than a year before the proposal, and 7 in 10 took at least one wedding-related action before becoming engaged (The Knot 2026 study). These behaviors provide context around the average. They do not show that living together or early planning caused an engagement to happen sooner or later.
Several other milestones were common. Before engagement, 86% had spent major holidays together, 73% had attended a wedding together, 69% had vacationed with family, and 50% had owned a pet together (The Knot 2026 study). Those are shares of couples who later married in 2025, not a checklist for readiness.
The 2024 Jewelry and Engagement Study reported a broad distribution. Among recently engaged U.S. couples, 30% had dated for two years or less, 53% for two to five years, and 17% for six years or more (The Knot dating survey).
The study captured responses from 7,856 U.S. couples who became engaged between January 1 and November 8, 2024. Participants were recruited by email from The Knot or WeddingWire membership (The Knot spouse survey). The time bands are survey response categories. They do not reveal the exact duration within each band, and the phrase “two to five years” should not be converted into a four-year average.
The 53% middle band was the largest reported category. That does not mean 53% became engaged at a single point, and it does not make the midpoint a median. The 30% figure means two years or less, not exactly two years. (The Knot dating survey)
Start shopping early enough to compare options and leave room for production, especially if you want a custom design. The relationship averages on this page cannot set that schedule for you. Work backward from the proposal date and allow time for stone selection, design approval, handcrafting, and delivery.
Do Amore’s current custom-ring timeline says it shares 3D renderings within a few days after a custom order is placed. Once the buyer approves the renderings, the company says the finished ring arrives within two to three weeks. Starting early gives you time to review the design without turning a private milestone into a race.
Public opinion is a different measure from observed couple behavior. YouGov asked U.S. adults how long couples should be together before engagement. The resulting percentages describe expectations, not the timelines respondents personally followed.
The 2026 and 2018 YouGov questions used different wording and response structures. They can be read side by side, but a change between the two should not be treated as a trend without a consistent series.
Put the surveys side by side and the distinction becomes obvious. The Knot asked engaged or married couples about what had happened in their relationships (The Knot 2026 study) (The Knot dating survey). YouGov asked adults what they thought should happen (YouGov 2026 survey) (YouGov 2018 poll). Both are legitimate research questions, but they measure different things.
An opinion result can include social norms, personal values, and memories of past relationships. An observed-duration result records a timeline among people who reached a specific milestone and joined a wedding platform. Neither design represents all relationships, including couples who never plan to marry or people whose relationships ended before engagement.
This explains why the article does not combine the percentages into a single chart or average. A 2026 belief about a minimum wait cannot share a denominator with a 2024 category describing actual time before engagement. Doing so would create a statistic no source reported.
In a survey conducted from January 30 to February 1, 2026, 53% of U.S. adult citizens said couples should be together for at least one year before getting engaged. Within that group, 11% said the minimum should be at least three years (YouGov 2026 survey).
Women were more likely than men to choose at least one year, at 58% versus 48%. Divorced adults were more likely than married adults to select at least one year, at 63% versus 51% (YouGov 2026 survey). These are descriptive subgroup differences. The survey does not establish why the groups answered differently.
The same poll asked about marriage as a separate milestone. Seventy percent said couples should be together for at least one year before marrying, including 21% who chose at least three years (YouGov 2026 survey). A view about the minimum time before marriage cannot stand in for the preferred time before engagement.
The online survey included 1,104 U.S. adult citizens from YouGov’s opt-in panel. Results were weighted on demographic, voting, party-identification, and registration variables to represent U.S. adult citizens. YouGov reported an approximate margin of error of plus or minus 4 percentage points for the overall sample (YouGov 2026 survey).
The earlier YouGov poll was fielded on June 28, 2018, among 7,461 U.S. adults. It asked how long two people should date before getting engaged (YouGov 2018 poll).
Only 2% chose less than six months. Another 18% selected six to 12 months, and 20% selected 12 to 18 months (YouGov 2018 poll). The 12-to-18-month band was the most selected defined period in that poll.
For longer periods, 15% chose 18 to 24 months and another 15% chose two to three years. Four percent selected three to four years, 2% selected four to five years, and 2% selected more than five years (YouGov 2018 poll). The remaining 22% chose “other” or “not sure.”
These nine response shares add context without creating an average. The categories reflect opinions in 2018, and their wording differs from the “at least one year” summary used in the 2026 poll.
The UK evidence comes from Bridebook surveys of engaged or recently married couples. A 2024 report supplies a direct mean for dating-to-engagement. A 2017 report follows an older group through dating, cohabitation, engagement, and marriage. (Bridebook 2017 report)
The figures are useful within their own cohorts. They should not be treated as current global norms or directly compared with U.S. platform data as if every survey sampled the same population.
Bridebook reported an average dating-to-engagement duration of 4.7 years (Bridebook engagement survey). The survey drew feedback from more than 3,500 engaged couples planning weddings in the UK for 2024 and beyond.
The report found that 23% of engaged respondents were part of Gen Z, which it described as a 12% increase compared with people married in 2022 (Bridebook engagement survey). The survey reflects Bridebook users and engaged couples planning future celebrations rather than every UK relationship because it was organized around wedding planning.
Proposal and discussion patterns varied across age groups. Among people in their twenties, 53% said they discussed marriage before engagement, compared with 32% of those in their forties (Bridebook engagement survey). The same report said 27% of younger couples proposed while on holiday and 49% of Gen Z couples sought a parental blessing beforehand.
After the proposal, 67% shared their engagement on social media within one day. Bridebook reported that 61% to 71% of couples did not film or photograph the proposal (Bridebook engagement survey). The wide range is preserved exactly because the page does not provide a single combined percentage.
Bridebook’s 2017 Marriage Report surveyed 4,000 recently married UK couples. It reported an average total relationship duration of 4.9 years before marriage (Bridebook 2017 report). That figure is total pre-marriage relationship time, not dating-to-engagement alone.
The reported sequence began with 1.4 years, or 17 months, of dating before moving in together. Couples then lived together for an average of 1.83 years, or 22 months, before engagement. Their engagement lasted an average of 1.67 years, or 20 months, before marriage (Bridebook 2017 report).
Bridebook separately reported an average of 3.5 years living together before marriage. It found that 89% of surveyed couples lived together before marriage and that 84% discussed marriage before the proposal (Bridebook 2017 report).
Respondents reported an average of two previous serious relationships before marriage. This describes the 2017 newlywed sample and is not evidence that any number of prior relationships improves a later marriage. (Bridebook 2017 report)
The recent headline means point in the same broad direction. Both the 2025 U.S. newlywed sample and the 2024 UK engaged sample reported multi-year dating periods before engagement (The Knot 2026 study) (Bridebook engagement survey). The U.S. mean was 3 years, and the UK mean was 4.7 years. The 1.7-year numerical difference is visible, but the studies do not support an explanation for it.
Several design differences stand between the two estimates. The U.S. participants had already married, but the UK participants were engaged and planning weddings. The Knot recruited from two platform memberships by email. Bridebook describes feedback from its own engaged users. Each service reaches a different customer base, and neither page supplies a common weighting scheme that would make the estimates nationally comparable.
The field periods differ as well. The U.S. report covers marriages completed during 2025 (The Knot 2026 study). The UK report describes weddings planned for 2024 and beyond (Bridebook engagement survey). Economic conditions, age mix, and platform use can shift across years even when the underlying question sounds similar.
The older UK study adds a useful timeline but should remain separate. Its 4.9-year total runs through marriage, so it includes a 20-month engagement (Bridebook 2017 report). Comparing that total with a dating-to-engagement mean would overstate the dating period. The article labels it total relationship duration before marriage every time it appears.
The cross-country takeaway needs to stay modest. Several years of dating appeared in both surveyed populations, and both showed wide variation around the headline. The evidence does not establish that UK couples wait longer on average than U.S. couples, because the samples and outcomes were not designed for that national comparison.
Even the word “average” deserves care in a country comparison. A mean reflects every reported value, including unusually short and long durations. The composition of the sample determines how much weight each response receives. If one platform reaches more first-time newlyweds and another reaches a different age mix, their means may differ without revealing a national behavioral gap.
That is why the page gives readers the sample, population, and field context beside the number. The supporting details are part of the finding, not fine print. A bare 3-year or 4.7-year claim would sound more universal than the research allows. (The Knot 2026 study) (Bridebook engagement survey)
The same caution applies when a rounded figure is repeated in search results, summaries, or advice articles without the original survey’s scope and method.
Cohabitation appears in both the recent U.S. data and the older UK report, but the measures are different. In the 2025 U.S. sample, 70% lived together before engagement (The Knot 2026 study). In the 2017 UK newlywed sample, 89% lived together before marriage (Bridebook 2017 report). One measure ends at engagement, and the other ends at marriage.
The 2017 UK report gave a 17-month average from dating to moving in and a further 22-month average from moving in to engagement (Bridebook 2017 report). Those interval means help describe the surveyed sequence. They should not be added to a different survey’s engagement length or treated as a current UK dating average.
The 2024 U.S. Jewelry and Engagement Study found that 69% lived together before engagement and 51% owned a pet together (The Knot engagement survey). It reported that 78% discussed political affiliations and 87% talked about the possibility of having children before engagement (The Knot engagement survey). These are common experiences in one platform sample, not causal drivers of engagement timing.
The Knot’s 2025 U.S. newlywed data put the average engagement at 14 months. Roughly 40% of couples were engaged for 11 to 18 months, and nearly 60% started wedding planning less than a month after engagement (The Knot 2026 study). The 11-to-18-month figure is a category share, but 14 months is the mean.
The older 2017 UK sample reported an average engagement of 20 months (Bridebook 2017 report). Comparing that figure with the 2025 U.S. mean would mix countries, cohorts, and collection periods. It would say nothing about whether one length is preferable.
Dating-to-engagement and engagement-to-marriage answer separate questions. A couple who dated for three years and had a one-year engagement had four years of total relationship time before marriage, but a published survey total should be used whenever one exists. That avoids creating new estimates from rounded component averages.
The 2025 U.S. newlywed study found that 9 in 10 couples discussed finances and money management before engagement. Eighty-five percent discussed the possibility of children, and another 85% discussed mental health (The Knot 2026 study).
Wedding details came up early too. Sixty-four percent discussed the size of a future wedding, and 60% discussed the time of year before becoming engaged. Fifty-one percent discussed proposal preferences in advance, and 53% had a private proposal (The Knot 2026 study).
The 2024 engagement study gives another view. It found that 57% discussed marriage or engagement more than a year before the proposal. Seventy-seven percent of proposees were involved in selecting or buying the ring in some way, 8 in 10 proposers said their partner dropped hints about preferences, and 29% intentionally looked at designs together (The Knot engagement survey).
Readers who want broader context on ring choices can consult Do Amore’s engagement ring statistics.
These discussion and shopping percentages show what respondents reported doing. They cannot tell us whether any one conversation guarantees readiness, prevents conflict, or produces a stronger marriage.
For shopping behavior beyond proposals, the jewelry shopping statistics page covers market and consumer measures.
The average length of dating before engagement compresses many individual answers into one number. Couples above and below it both contribute to the result. The 2024 U.S. categories make that variation visible, with respondents spread across two years or less, two to five years, and six years or more (The Knot dating survey).
Who gets surveyed matters. The Knot studies recruited members of wedding platforms by email. YouGov’s 2026 results came from a weighted opt-in panel. Its 2018 result used an adult opinion sample. Bridebook surveyed people using a wedding-planning service in the UK.
Self-report creates another limitation. People may remember relationship start dates differently, interpret “dating” in their own way, or round a duration. Country, age, culture, and whether a person is engaged or newly married can change who appears in a sample.
Relationship start dates can be fuzzy in self-reported research. One person may count the first date, another the day the relationship became exclusive, and someone else the point when both partners started using a label. None of the source reports gives every respondent one published definition detailed enough to remove that ambiguity. Rounded answers introduce another limit, because “about three years” is less precise than a timeline reconstructed from dated records.
The safest reading stays at the scale each source provides. Means support broad comparisons within their samples. Grouped answers should remain inside their published bands. A recently married respondent reports a completed courtship, an engaged respondent reports before the wedding, and an adult opinion poll may include people with no personal marriage plan. Those denominators answer different questions, so this page does not combine them into a synthetic average or claim that one country waits an exact number of years longer.
That restraint matters when a difference looks precise on paper. Independent surveys can show direction and context, but their decimal points do not erase differences in recruitment, wording, and life stage.
None of the original reports publishes a global estimate. They do not provide a single median dating-to-engagement figure that can be compared across all six studies. The 2024 U.S. source uses broad categories, and the Bridebook page does not show subgroup sample sizes for its age comparisons.
The platform studies do not include couples who never used those services. Those samples begin with engagement or marriage, so they cannot describe all dating relationships. They cannot show how many relationships ended before engagement, which would require a different research design and a clearly defined starting population.
The YouGov polls solve a different problem by surveying adults, but they ask for opinions. Weighting helps the 2026 panel resemble the adult-citizen population on selected variables (YouGov 2026 survey). It does not turn a preferred minimum into observed behavior or remove every possible source of opt-in-panel bias.
No report tested whether duration itself caused later outcomes. The 2017 Bridebook page includes respondents’ views about marriage, but those views cannot be linked causally to the time they dated (Bridebook 2017 report). For this reason, relationship-satisfaction and divorce-risk claims are excluded from the article.
For those reasons, the data supports a descriptive answer only. Recent U.S. and UK studies show that multi-year dating periods are common in the surveyed groups. They do not identify a deadline, an ideal, or a timeline that causes relationship success.
Couples should discuss their engagement ring budget, style, stone preferences, and how much of the choice should stay a surprise before shopping.
These talks do not prove readiness for engagement, but they can prevent avoidable guesswork once both partners agree on the future.
Do Amore’s current FAQ says its online team can send detailed photos and videos of rings and offers up to three rounds of CAD renderings for custom designs. Those tools let couples review proportions and design details before production. Agree on the choices that matter, then decide which details one partner wants to keep for the proposal.
These answers separate averages, response ranges, publication years, and relationship stages so each number keeps its original meaning.
The average time before engagement varies by source. The latest direct means reviewed here are 3 years among U.S. couples who married in 2025 (The Knot 2026 study) and 4.7 years among engaged couples planning UK weddings for 2024 and beyond (Bridebook engagement survey). The surveys cover different countries and populations, so neither figure is a universal average.
In The Knot’s 2024 U.S. sample, 30% of recently engaged couples said they had dated for two years or less (The Knot dating survey). The study included 7,856 platform members engaged from January 1 through November 8, 2024 (The Knot spouse survey). The category includes every duration up to two years and should not be read as exactly two years.
No. This page was prepared for 2026 publication. Its evidence covers a 2026 opinion poll, couples married in 2025, couples engaged or planning weddings in 2024, a 2018 U.S. poll, and a 2017 UK newlywed survey. Each year is shown beside the relevant finding.
Dating-to-engagement measures the relationship from its start to the proposal or engagement. Engagement-to-marriage measures the period from engagement to the wedding. Total relationship duration before marriage can include both periods, plus any separately measured time around cohabitation.
No. These studies describe timing, opinions, and reported behaviors. They do not establish that a shorter or longer courtship causes a relationship to succeed, and this page does not use descriptive averages as a proxy for compatibility.
Statistics on how long couples usually date before getting engaged show a broad pattern rather than a prescription. In the reviewed U.S. and UK samples, many couples dated for several years before engagement. Substantial groups followed shorter or longer paths.
Country, cohort, question wording, and sampling method all affect the figures. Use the numbers to understand how surveyed couples and adults answered. Keep personal decisions grounded in the relationship itself rather than a single benchmark.
A timeline can show what other couples did, but it cannot choose the right moment or ring for you. Once you both feel ready, the next step should reflect your shared values and the life you want to build.
Every Do Amore purchase gives one person access to clean water. See how the one-to-one clean-water program works, then choose a ring only when the timing feels right for both of you.