









Your bag is empty
Explore timeless jewelry that carries love and inspires lasting impact.
We promise that every purchase you make gives one person access to clean, life-changing water.
Explore timeless jewelry that carries love and inspires lasting impact.
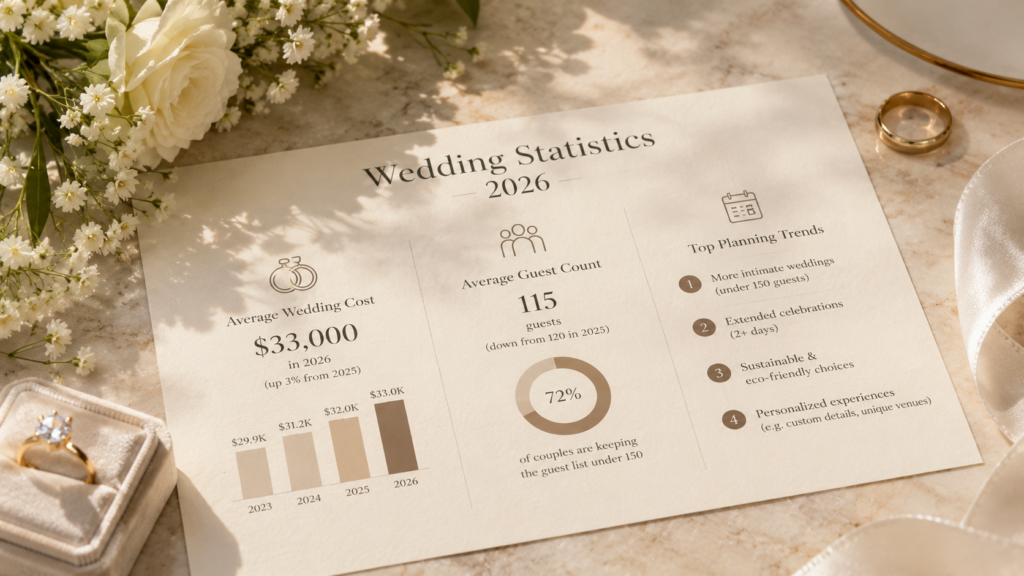
Wedding statistics published in 2026 do not all describe weddings held in 2026. The clearest current picture combines official 2024 marriage registrations, survey results from US couples married in 2025, partial 2026 payment activity and the plans of couples preparing to marry in 2026.
The headline numbers are useful, but only when you keep the year, country, population and method attached. This guide does that throughout, so you can use the data as context without treating someone else’s average as your target.
| Statistic | What it measures | Year + source |
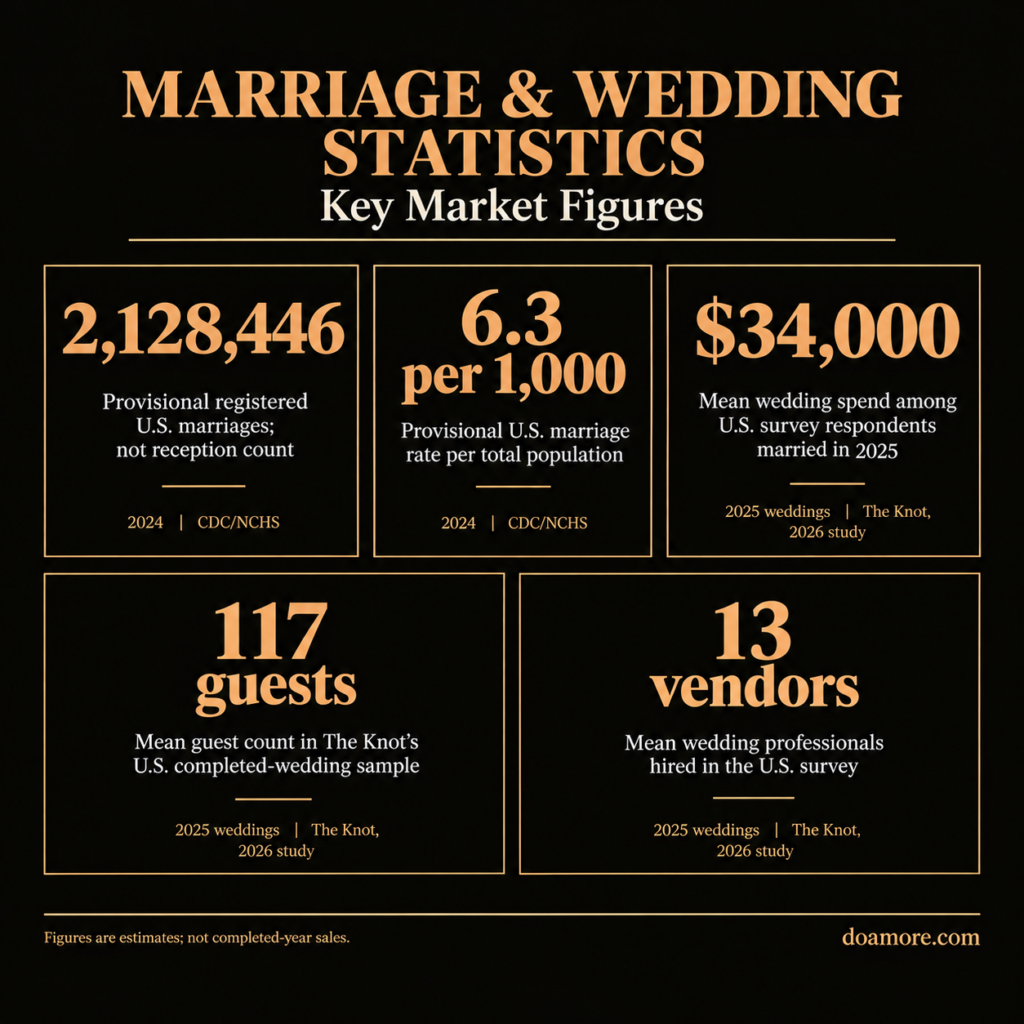
| 2,128,446 | Provisional registered U.S. marriages; not reception count | 2024 | CDC/NCHS |
| 6.3 per 1,000 | Provisional U.S. marriage rate per total population | 2024 | CDC/NCHS |
| $34,000 | Mean wedding spend among U.S. survey respondents married in 2025 | 2025 weddings | The Knot, 2026 study |
| 117 guests | Mean guest count in The Knot’s U.S. completed-wedding sample | 2025 weddings | The Knot, 2026 study |
| 13 vendors | Mean wedding professionals hired in the U.S. survey | 2025 weddings | The Knot, 2026 study |
National wedding statistics make more sense when the publication year and measurement year stay separate. A 2026 report might describe completed weddings from 2025, a survey of couples who expect to marry in 2026 or transactions recorded only through May 2026.
Those distinctions matter because each source answers a different question. Completed-wedding surveys describe what respondents say happened. Planning surveys describe intentions that may change.
Transaction data tracks selected payments, not every expense. Government records count legal marriages, not receptions.
An average does not tell you what a typical couple spent. A small number of large weddings can pull a mean upward. A median, when available, identifies the middle result. Neither figure becomes a recommendation solely because it is national or widely quoted.
Platform surveys have another limit. Respondents are people who use, or are reachable through, a particular wedding platform. Their results can be broad and useful without perfectly representing every couple in the country.
For that reason, the figures below are labeled as official counts, observed outcomes, plans or transaction proxies. No forecast is treated as fact, and figures from different populations are not combined into a new average.
Before comparing any published figure with your own plan, write down the wedding year, country, people surveyed and costs included. That small note keeps a planned budget, payment proxy or platform average from quietly becoming a rule for your celebration. The note makes later vendor quotes easier to evaluate.
The latest official figure in the planned source set is 2,128,446 US marriages in 2024. The provisional marriage rate was 6.3 per 1,000 people, based on a total US population of 340,110,988. These are National Vital Statistics System registrations, not an estimate of commercial wedding events. (CDC/NCHS)
The 2024 count rose from 2,041,926 marriages in 2023. The rate moved from 6.1 to 6.3 marriages per 1,000 population. In 2019, before the sharp disruption of 2020, the United States recorded 2,015,603 marriages and a rate of 6.1. (CDC/NCHS)
That comparison shows why counts and rates should stay separate. The number of marriages can rise as the population grows even when the rate changes less. The rate gives population context. The count shows the number of legal registrations.
The long view is different from the recent one. In 2000, the United States recorded 2,315,000 marriages and a rate of 8.2 per 1,000 people. By 2024, the count was lower and the population was much larger, producing a rate of 6.3. (CDC/NCHS)
Official marriage records are the best source for legal volume, but they do not reveal ceremony size, guest count, vendor use, location or total spending. A courthouse marriage and a multi-day celebration each appear as one registered marriage.
That is why US wedding industry statistics based on event estimates should not replace the government count. The Knot described about 2 million US couples marrying in 2025, but that is an industry estimate tied to its market research, not a National Vital Statistics System total. (The Knot Real Weddings Study)
The U.S. Census Bureau estimated median age at first marriage at 30.8 for men and 28.4 for women in 2025, compared with 23.5 and 21.1 in 1975. These CPS ASEC estimates describe first-marriage timing, not engagement age or the average age of every wedding guest and couple.
Pew Research Center’s October–November 2023 survey found that 69% of never-married respondents ages 18–34 wanted to marry someday, 23% were unsure and 8% did not. The broader survey included 1,495 young U.S. adults with a living parent they remained in contact with, excluding those still in high school. These are stated intentions within the eligible sample, not a forecast of future wedding bookings.
The Knot’s original PDF report supplies useful distribution context: for 2025 weddings, it gives a $24,000 median and a $34,000 average, with the middle half of couples spending $12,000–$41,000. Averages alone hide that spread. The report’s wedding-cost figures describe its survey population and should not be multiplied by the CDC marriage count to manufacture a national spending total.
These sources do not include a completed full-year 2026 national wedding-cost result. The newest completed-wedding benchmark is $34,000 for US couples married in 2025. The $36,000 figure often described as a 2026 cost is a planning benchmark from couples expecting to marry in 2026. (The Knot Real Weddings Study) (Zola First Look Report)
Both figures can be accurate within their own studies. They should not be averaged together or treated as instructions. Location, headcount, vendor mix, event length, season and family contributions can move an individual budget far away from either number.
The Knot’s 2026 Real Weddings Study collected self-reported responses from 10,474 adult US couples who married between January 1 and December 31, 2025. Respondents were recruited from The Knot and WeddingWire memberships by email during 2025. (The Knot Real Weddings Study)
Within that population, the average wedding cost was $34,000. Average spending per guest was $292, up $8 from the source’s 2024 result. Three in four respondents said the wedding was financially worth the cost. (The Knot Real Weddings Study)
Economic pressure was common. Eighty-five percent said the economy affected their planning. Among respondents who adjusted their budgets, 77% increased spending rather than reducing it. Those percentages describe the survey group, not every couple in the United States. (The Knot Real Weddings Study)
The study placed total US wedding-event spending above $100 billion and estimated about 2 million couples married in 2025. Those are market measures from the publisher, not government registrations, and the report notes that some findings come from separate studies of engaged or newlywed couples. (The Knot Real Weddings Study)
Zola surveyed more than 11,500 couples getting married in 2026. It reported an average planned wedding cost of $36,000 and an average planned guest count of 145. Because the public page does not state the survey geography, these figures should remain Zola planning benchmarks rather than US national averages. (Zola First Look Report)
Plans are valuable because they show expectations before bills are final. They are not completed outcomes. Vendor changes, guest responses, added events and price changes can all alter what a couple eventually pays.
The Zola sample expected celebrations to extend beyond one day. Thirty-seven percent planned at least one extra event, such as a welcome party or next-day brunch, and 18% planned a two-to-three-day wedding weekend. These choices may help explain why two weddings with similar ceremony guest counts can have different totals. (Zola First Look Report)
Use the $34,000 and $36,000 figures to understand the range captured by these platforms, then build your own total from real quotes and priorities. An average cannot know your city, your guest list or what matters most to you. (The Knot Real Weddings Study) (Zola First Look Report)
The best recent completed-wedding benchmark here is 117 guests among the 10,474 US couples married in 2025 in The Knot’s self-reported study. Zola’s separate survey of couples planning 2026 weddings reported 145 planned guests, with no country stated on the public report. (The Knot Real Weddings Study) (Zola First Look Report)
Wedding industry statistics need that context. A 28-guest difference is not proof that weddings suddenly became larger. It may reflect different populations, timing, questions or platform users. One result looks backward at completed weddings. The other looks forward at plans. (The Knot Real Weddings Study) (Zola First Look Report)
Guest count has an outsized practical effect because it touches venue capacity, meals, rentals, invitations, transportation and staffing. But it is not the only cost driver. A smaller wedding can still carry a high total if it includes a premium location, several events or a large vendor team.
The 2025 Global Wedding Report offers one carefully labeled US comparison among couples married in 2024. Within that platform sample, Gen Z couples hosted 131 guests on average, compared with 113 for Millennials and 88 for Gen X. (The Knot Global Wedding Report)
These results show correlation within one study population. They do not prove that age alone caused the difference. Income, life stage, family size, cultural traditions and the type of celebration may all contribute.
For your own plans, start with the relationships you want present and the experience you can comfortably host. A national or generational average can provide context, but it cannot choose the right room or the right people for you.
The international comparison covered 33,174 couples married during 2024. That included 16,956 respondents in the United States and 16,218 across Spain, Italy, France, the United Kingdom, Brazil, Mexico and India. Participants came through social media or invitations to members of The Knot and WeddingWire platforms. (The Knot Global Wedding Report)
India stood out at an average of 330 guests in that sample. The report described weddings in the United Kingdom and France as more intimate. Mexico and Brazil leaned toward higher guest counts. Exact cultural comparisons should stay within the source’s definitions and countries. (The Knot Global Wedding Report)
Destination wedding industry statistics need especially careful definitions. The study’s cost notes matter too. Its country averages excluded jewelry, the engagement ring and the honeymoon. It reported an average of $35,000 for India in US dollars. The report warned that a substantial share spent more. Currency conversion methods and dates are not detailed on the public page, so the figure should not be used for a direct budget comparison. (The Knot Global Wedding Report)
Most couples in Zola’s 2026 planning survey expected to pay at least part of the bill. Eighty-eight percent planned to contribute, with 29% fully funding the wedding and 59% contributing partially. Seventy-one percent expected some family help, and among those receiving help, 69% said both families were contributing. (Zola First Look Report)
Saving started early for many respondents. Fifty-one percent said they had saved for years before getting engaged. Another 27% added cash funds to their registry, up from 16% in the source’s 2025 survey. (Zola First Look Report)
Seventeen percent took a second or third job, rising to 23% among couples fully funding their weddings. Four percent reported taking out a loan. (Zola First Look Report)
The pressure extended beyond the wedding itself. Fifty-two percent said they were delaying another milestone. Among that group, 70% put general savings on hold, 59% delayed buying a home, 38% postponed debt repayment and 29% delayed starting a family. (Zola First Look Report)
Those results are a reason for care, not a reason to normalize financial strain. A wedding budget should protect the life you are building after the celebration. If a benchmark makes your plan feel too small, the problem may be the benchmark, not your plan.
Bank of America’s transaction data adds a different kind of signal. Average wedding-related spending per selected customer grew 8.5% year over year from January through May 2026. This is payment growth, not a wedding inflation index. It can reflect prices, quantities, vendors, deposits or changing event choices. (Bank of America Institute)
An engagement ring is easier to plan when it has its own budget line instead of a fixed percentage of the wedding total.
Do Amore’s made-to-order engagement rings use recycled precious metals and ethically sourced stones, but those choices still belong in the couple’s own plan. Compare the ring against real priorities and quotes, not against a national wedding average that may exclude jewelry altogether.
Many couples plan for about a year, but recent platform results range beyond that. The international report found a roughly one-year pattern among couples married in 2024, with the US sample averaging the longest lead time at 15 months. Zola’s separate 2026 planning survey reported an average engagement length of 18 months. (The Knot Global Wedding Report) (Zola First Look Report)
An engagement length is not always the same as active planning time. Some couples secure a venue immediately. Others wait months before making major decisions. A destination, popular date, custom ring or large guest list can stretch the process.
One of the clearest wedding planning trends in Zola’s 2026 sample is that planning began before a formal engagement. Sixty-eight percent said the decision to get engaged was mutual, 55% shopped for rings together and 28% built complete mood boards before the proposal. Nineteen percent said they had entered full wedding-planning mode before becoming officially engaged. (Zola First Look Report)
Early vendor steps were less common but growing within the source’s year-over-year comparison. Ten percent toured a venue before getting engaged, up from 8%. A further 7% booked a venue, up from 6%. These are observed behaviors in one planning-platform sample, not deadlines everyone should follow. (Zola First Look Report)
If ring shopping is part of those early conversations, Do Amore’s dedicated statistics page provides deeper context on how people research and choose. What matters is giving both partners enough room to talk about preferences, budget and meaning.
The 2025 Global Wedding Report studied couples who married in 2024 across eight countries. Most spent around a year planning. US respondents averaged 15 months. The survey did not ask its India respondents the planning-time question, so India should not be included in that timeline comparison. (The Knot Global Wedding Report)
Zola’s 18-month result describes engagement length among couples preparing for 2026 weddings. It should not be read as a three-month increase from the other study. The samples, countries, dates and measures differ. (Zola First Look Report)
Use these trends in wedding planning to set a planning range, then work backward from the decisions with genuine lead times. Budget, venue and guest-list choices usually shape the rest. The data does not support one universal schedule.
Before starting a custom ring, confirm the budget, design references, stone preferences and approval steps.
Do Amore’s custom ring process starts with your inspiration, follows with a quote and center-stone options, and shares 3D renderings after the order is placed. Couples approve the details before handcrafting begins, so the design has clear checkpoints instead of becoming an open-ended part of the wedding plan.
AI is now common enough to measure, but the adoption rate depends on who was asked. The Knot reported 36% AI use among its surveyed engaged couples, nearly double its prior-year figure. Zola reported 54% among its larger sample of couples planning 2026 weddings. (The Knot Real Weddings Study) (Zola First Look Report)
Neither percentage is a forecast. They are survey findings from different populations and questions. Both can be true without showing a single national adoption rate.
Zola’s users applied AI mainly to practical work. Among respondents using it, 54% asked etiquette questions, 44% managed timelines or task lists, 40% drafted messages, 31% used image tools for visual inspiration, 27% organized a budget and 27% worked on travel planning. (Zola First Look Report)
The same respondents drew lines around personal words. Sixty-three percent said AI had no place in vows, 44% said the same about speeches and 36% wanted it kept out of the ceremony script. Seventy-five percent said AI had not interfered with the emotional or human side of their wedding. (Zola First Look Report)
That tension makes sense. A tool can help sort a checklist without deciding what a promise should sound like. Couples can save time on logistics and still keep the most meaningful parts unmistakably their own.
Pinterest remained the most-used inspiration platform in Zola’s 2026 survey, used by 77% of respondents. TikTok reached 50%, up from 41% in the source’s 2025 survey. Twenty-five percent called TikTok their most valuable planning resource, rising to 30% among Gen Z respondents. (Zola First Look Report)
Online inspiration was not always harmless. Eighty-seven percent said they had made at least one planning decision based on social media. Forty-eight percent increased their budget or moved money between categories to achieve something seen online, and 60% named the gap between inspiration and budget as their leading planning stressor. (Zola First Look Report)
Social-first documentation was becoming part of vendor conversations. Twenty-one percent planned to create their own social-first content on the wedding day. Among that group, 40% asked professional photographers or videographers to gather social-ready footage. (Zola First Look Report)
Use online ideas as a menu, not a test. A trend can show you what is possible, but it does not know your budget or the people in the room.
Professional help remained central among US couples married in 2025. The Knot study reported an average of 13 vendors. Eighty-nine percent booked a venue, 88% hired a photographer and 85% hired a caterer. Two in three said hiring wedding professionals was necessary. (The Knot Real Weddings Study)
Price was not the only selection factor. Personality mattered to 53% choosing a DJ and 50% choosing a planner. Responsiveness mattered to 52% across vendor relationships. Thirty-seven percent contacted more vendors than first planned while looking for options that fit their budget. (The Knot Real Weddings Study)
Personal choices sat beside that professional support. Thirty-two percent included religious, ethnic or cultural elements, 22% chose locally sourced products and 61% wrote their own vows. The report said 28% included options it labeled “eco-friendly,” but that broad term belongs to the source and should not be expanded into an unsupported environmental claim. (The Knot Real Weddings Study)
A wedding can be highly organized and still feel personal. Vendors supply expertise. The couple decides what the celebration means.
Bank of America’s selected payment data showed the highest wedding-related activity in May across the past decade. In 2025, October and September followed May. The result is a transaction proxy, not a complete ceremony calendar. (Bank of America Institute)
The bank identifies an event by the first month in which a customer makes a wedding-related transaction. That payment might be a deposit, an engagement expense or another event around the ceremony. The underlying data is aggregated and anonymized, limited to selected Bank of America customers and usually not adjusted for seasonality, processing days or portfolio changes. (Bank of America Institute)
Florist payments offer one additional clue, with an important complication. The number of households spending more than $5,000 at florists peaked in May over the prior three years, followed by October. But Mother’s Day falls in May, so not every florist payment is wedding-related. (Bank of America Institute)
International seasonality varies. Couples married in 2024 within the global platform sample favored June in Italy and France, October in Mexico and February in India. December was a leading engagement month in the United States, United Kingdom, Brazil and Mexico. (The Knot Global Wedding Report)
Seasonal patterns can help with expectations, but they are not a promise of lower prices or better availability. Local demand, weather and vendor calendars matter more than a broad national month ranking.
Wedding reports do not always include the same categories. The 2025 Global Wedding Report explicitly excluded jewelry, the engagement ring and the honeymoon from its country cost figures. That definition alone can create a large gap between studies that appear to measure the same total. (The Knot Global Wedding Report)
Keep the engagement ring and wedding bands distinct as well. They are different purchases, often made at different times and influenced by metal, stone, design and whether the piece is custom. Without an authoritative source defining all of those variables, one average wedding-band price would create more confusion than clarity.
For a closer look at ring-shopping behavior, see Do Amore’s engagement ring statistics.
Decide what the rings mean to you, compare real options and keep that choice inside a comfortable total. A fixed share of the wedding budget cannot capture that personal decision.
For broader context, Do Amore’s jewelry market statistics page explains how bridal jewelry fits within the overall category.
Start with a ceiling you can live with after the wedding. Then build from the parts that control the most money, including guest count, venue, food, event length and the number of professionals involved.
A national average is most useful as a question starter. It can prompt you to ask what is included, which categories tend to move with headcount and where your local quotes differ. It cannot replace those quotes.
Begin with the money you can spend without borrowing from goals that matter after the wedding. Keep that ceiling separate from any number in a report. If family members are contributing, confirm the amount and whether it comes with expectations before assigning it to a category.
Next, make a rough guest list before choosing a venue. The list does not need to be final, but it should be realistic enough to reveal whether you are planning for 50 people, 120 people or 200 people. That difference affects more than catering. It can change the rooms available to you, the number of tables, transport needs and the size of the vendor team.
Then collect comparable quotes. Ask each vendor to price the same date range, guest estimate, service level and event length. One quote may look lower because it excludes delivery, staffing, rentals, taxes or service charges. Put those items on the same page before deciding which option offers better value.
Separate commitments from preferences. A signed venue contract is a commitment. A flower idea saved from social media is still a preference. This keeps new inspiration from quietly competing with money already promised elsewhere.
A small change reserve helps. Guest counts move, attire needs alterations and plans gain details. A reserve lets those changes happen without forcing a last-minute decision between two priorities you care about.
Review the plan together at a few natural checkpoints. The first can follow venue selection, when the date and capacity are real. The next can come after invitations, when attendance is clearer. A final review before remaining balances are due can catch duplicate rentals, unneeded extras or categories that grew without discussion.
When you compare your total with the average cost of a wedding in a published study, compare the definitions too. Check whether the source includes jewelry, a honeymoon, rehearsal events or next-day gatherings. Look at whether the number is planned or completed and whether it describes your country. If those details do not match, the difference may tell you more about the study than about your budget.
This exercise turns a broad benchmark into better questions, clearer vendor comparisons and a plan that still feels comfortable when the celebration is over. You do not need to land close to $34,000 or $36,000. Use those figures as context, never a command. (The Knot Real Weddings Study) (Zola First Look Report)
Write down what the total excludes as clearly as what it includes. If the honeymoon, rings, tips or travel sit in separate budgets, label them that way. This makes the plan easier to explain to anyone contributing and prevents a partial total from being mistaken for the complete cost. The record gives you a fairer comparison with any published study you consult later.
The five sources in this guide are strongest when each stays in its lane. The CDC answers how many legal marriages were registered. The Knot’s annual US survey describes self-reported completed weddings and some separately fielded research. Bank of America shows directional payment behavior among selected customers.
Zola captures the intentions of couples planning 2026 weddings. The global report compares platform members who married in 2024 across eight countries. (Zola First Look Report) (The Knot Global Wedding Report)
Statistics about the wedding industry can offer useful breadth, but this mix is not one continuous dataset. You cannot use the CDC count as the denominator for a platform survey percentage, because the people and events were not sampled together. You cannot turn Bank of America’s 8.5% spending growth into a change in the national average wedding cost. The bank tracks classified transactions among its own customers. Survey publishers ask couples to report or plan a total. (Bank of America Institute)
The $34,000 and $36,000 cost figures are a good example. The first comes from US couples looking back at weddings completed in 2025. The second comes from couples planning weddings in 2026, with geography not stated on the public page. Different dates, populations and stages of the planning process can easily produce different averages without either source being wrong. (The Knot Real Weddings Study) (Zola First Look Report)
Guest counts work the same way. An average of 117 completed-wedding guests and 145 planned guests do not establish a 24% increase. Some invitations will be declined, some plans will change and the platforms may reach different couples. Treat the figures as separate benchmarks. (The Knot Real Weddings Study) (Zola First Look Report)
The same caution applies to technology findings. The Knot’s 36% AI adoption and Zola’s 54% result came from different survey contexts. The gap should encourage questions about wording and population, not a made-up midpoint of 45%. (The Knot Real Weddings Study) (Zola First Look Report)
Start by finding the measurement year, not only the publication date. Then identify the country or countries, sample size, recruitment method and whether the result describes an intention, an outcome or a payment proxy.
Next, look for exclusions. The global report leaves jewelry, the engagement ring and the honeymoon out of its country cost figures. The CDC count says nothing about a reception.
Bank of America’s merchant categories can include activity beyond weddings. These details change what a number means. (CDC/NCHS) (Bank of America Institute) (The Knot Global Wedding Report)
Finally, check whether a percentage applies to the full sample or a subgroup. Zola’s 70% delaying general savings, for example, sits inside the 52% who said they postponed another milestone. It does not mean 70% of every respondent delayed saving. (Zola First Look Report)
Good statistics sharpen judgment by showing what was measured and what remains unknown.
When you share a figure with a partner, planner or family member, carry the qualifier with it. “US couples married in 2025” is more useful than “weddings cost this much.” That small habit keeps a benchmark from becoming pressure and makes conversations about tradeoffs much more honest.
These quick answers separate completed outcomes from planning surveys and payment signals.
No. The $34,000 figure is the average reported by 10,474 US couples who married in 2025 and responded to The Knot’s 2026 Real Weddings Study. A completed full-year 2026 national result is not available in these sources. (The Knot Real Weddings Study)
Zola’s $36,000 figure is a separate planned-cost benchmark among more than 11,500 couples expecting to marry in 2026. The public report does not state geography, and planned amounts can change before the event. (Zola First Look Report)
The Knot reported 117 guests on average among its 10,474 US respondents married in 2025. Zola reported 145 planned guests among its 2026 planning sample, whose geography is not stated publicly. (The Knot Real Weddings Study) (Zola First Look Report)
The figures answer different questions. Neither is a target for your guest list.
Selected Bank of America customers spent 8.5% more per person on wedding-related transactions from January through May 2026 than during the same period a year earlier. The data covers classified payments across selected customers and is not a pure wedding-price index. (Bank of America Institute)
Higher spending can reflect price increases, more events, different vendors or larger quantities. It does not prove that every couple’s wedding became 8.5% more expensive. (Bank of America Institute)
Couples married in 2024 across the 2025 Global Wedding Report’s eight-country sample usually planned for about a year, with US respondents averaging 15 months. India was excluded from that planning-time question. (The Knot Global Wedding Report)
Zola reported an 18-month average engagement among its couples planning 2026 weddings, and 19% said they entered full planning mode before the proposal. That is a separate sample, not a universal timeline. (Zola First Look Report)
Wedding statistics can make an unfamiliar process feel more manageable. Use them to understand the broader picture, then return to the people, finances and priorities that make your celebration your own.
Keep the ring in its own budget line and compare the choices that matter to you. If the tradeoffs feel hard to sort, ask Do Amore for a second set of eyes.
Once you have a comfortable overall budget, you can explore engagement rings at your own pace or ask Do Amore for guidance. Every purchase gives one person access to clean water, so the ring can mark your commitment while helping another life move forward.