








Your bag is empty
Explore timeless jewelry that carries love and inspires lasting impact.
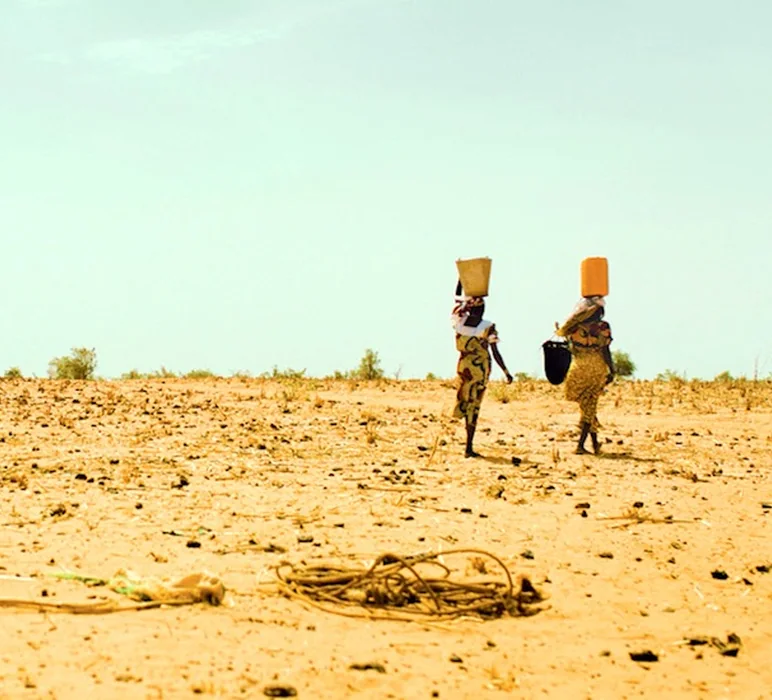
We promise that every purchase you make gives one person access to clean, life-changing water.
Explore timeless jewelry that carries love and inspires lasting impact.

The clearest 2026 diamond statistics still begin with 2025. That is the latest complete calendar year in the Kimberley Process data available when this article was researched on October 15, 2026. Those official figures show reported natural rough-diamond production of 98.82 million carats, not a 2026 forecast and not a measure of polished jewelry sales (Kimberley Process 2025 summary).
These diamond industry statistics track mine output, cross-border rough trade, polished exports, company revenue, and retail demand at different points in the diamond pipeline. Keeping them separate lets you compare each number with the right year, place, unit, and market stage.
| Statistic | What it measures | Year + source |
| 98.82 million carats | Reported worldwide natural rough-diamond production, rounded | 2025 | Kimberley Process |
| $9.23 billion | Reported value of worldwide natural rough-diamond production, rounded | 2025 | Kimberley Process |
| $93.43 per carat | Reported global rough-production unit value; not retail polished price | 2025 | Kimberley Process |
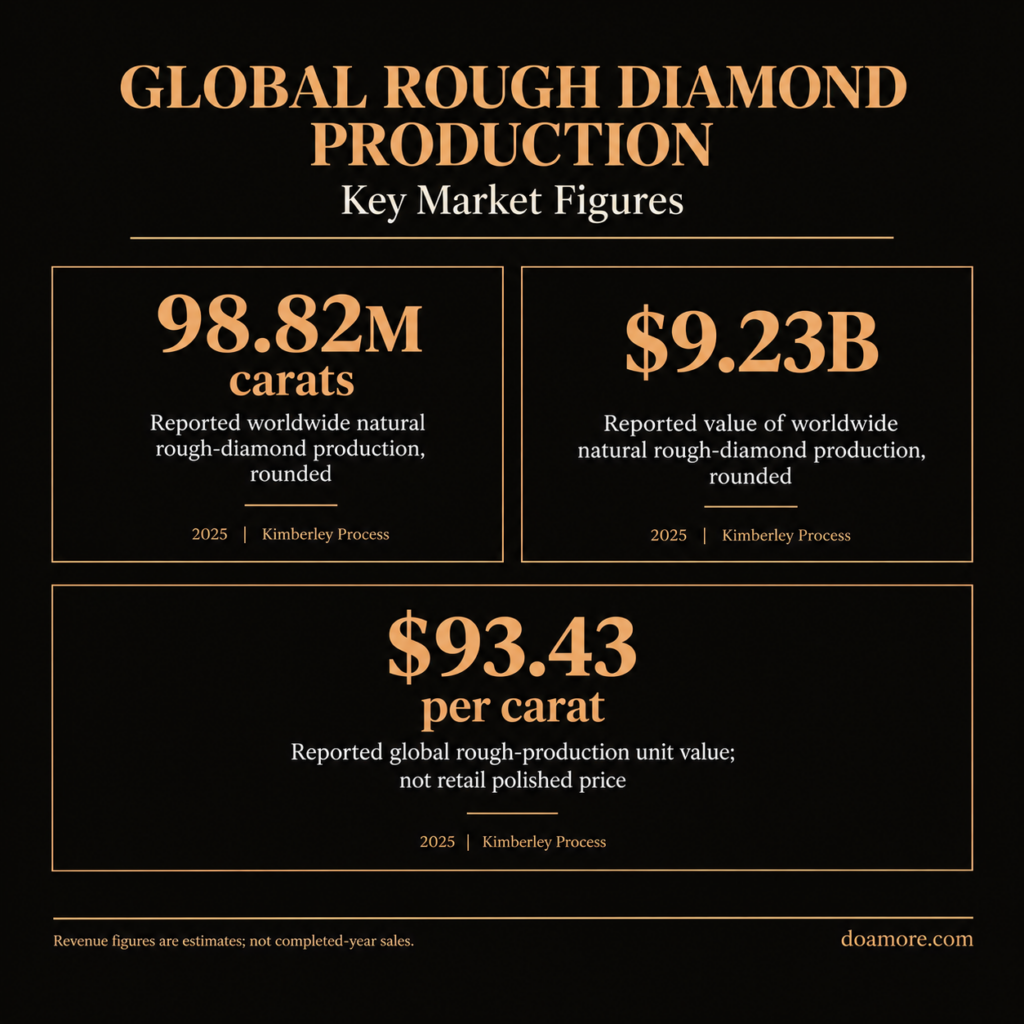
Every figure needs a label. Carats tell you how much material was reported. U.S. dollars capture its stated value. Divide value by carats and you get an average, one that shifts with the quality and mix of stones in the dataset.
Imports and exports are gross cross-border flows. A rough diamond may move through more than one trading hub before it is cut, so import and export totals can both be much larger than annual mine production. Adding imports and exports together would double count activity and would not produce a valid diamond market size.
A diamond enters trade as rough, meaning it has been mined but not yet cut or polished. Once shaped and finished, it is counted as polished. Kimberley Process production and trade statistics cover rough natural diamonds within the certification system, not finished stones or retail jewelry.
Antwerp data includes rough, polished natural, synthetic, and industrial categories. India’s figures describe cut and polished exports. Those series offer useful views of trade, but neither is a complete measure of global retail demand. For a broader downstream view, Do Amore’s jewelry market statistics cover market size, sales, and shopping behavior without mixing those figures into mine output.
Production volume counts the carats recovered from mines. Production value estimates what that output was worth while still rough. Average value per carat reflects the mix of stones in the dataset, so it should never be read as the price of a finished engagement-ring diamond.
Country averages can vary sharply because mining operations recover different qualities and sizes of stones. Namibia’s reported 2025 production averaged $343.88 per carat. Lesotho averaged $330.90 per carat. The global average was $93.43 (Kimberley Process 2025 summary). These figures reveal differences in production mix, not a universal price list.
The 2026 in the title marks publication, not the reporting period for every dataset. Most complete global results here cover calendar 2025. India’s figures use a fiscal year, and the De Beers update covers H1 2026. Both are labeled where they appear.
No unsupported global 2026 total has been extrapolated from 2025. The strongest comparison is between like-for-like official annual datasets. Where this article calculates a change, it subtracts the 2024 value from the 2025 value, divides by the 2024 value, and multiplies the result by 100.
The latest global diamond production total from the Kimberley Process was 98,824,642.80 carats of natural rough-diamond production for 2025. The reported production value was $9,232,848,542.95, producing a weighted average of $93.43 per carat (Kimberley Process 2025 summary).
Rounded for readability, that is about 98.8 million carats worth $9.23 billion. This figure captures value at the rough-production stage. Cutting, trading, jewelry manufacturing, and retail each measure different activity, so none belongs in the total. (Kimberley Process 2025 summary)
The exact 2025 totals give an auditable baseline of 98,824,642.80 carats, $9,232,848,542.95 in value, and $93.43 per carat (Kimberley Process 2025 summary). In 2024, the comparable totals were 129,124,016.28 carats, $11,282,322,552.58, and $87.38 per carat (Kimberley Process 2024 summary).
Based on those source inputs, production volume fell 23.47%, and production value fell 18.17%. Yet average reported value per carat rose 6.92% (Kimberley Process 2025 summary) (Kimberley Process 2024 summary). That combination is possible because fewer carats were reported, but the mix of reported production shifted toward a higher average value.
Russia led 2025 production by volume with 31,511,941.67 carats. It represented 31.89% of global reported volume and 29.51% of value (Kimberley Process 2025 summary) (Kimberley Process 2025 charts).
Botswana followed with 15,495,829 carats valued at $1,978,204,562. Its shares were 15.68% of global volume and 21.43% of value (Kimberley Process 2025 summary) (Kimberley Process 2025 charts). Angola reported 15,195,293 carats worth $1,811,575,243.07, equal to 15.38% of volume and 19.62% of value (Kimberley Process 2025 summary) (Kimberley Process 2025 charts).
Canada produced 14,103,511 carats worth $892,505,366.39 and held 14.27% of volume (Kimberley Process 2025 summary) (Kimberley Process 2025 charts). The Democratic Republic of the Congo reported 8,913,219.39 carats, or 9.02% of global volume (Kimberley Process 2025 summary) (Kimberley Process 2025 charts). The ranking by value differs because average rough values vary across countries.
The global decline was not evenly distributed. Russia’s reported production volume fell 46.17%, from 58,543,796.28 carats in 2024 to 31,511,941.67 in 2025. Botswana’s volume fell 14.51%, and the Democratic Republic of the Congo’s fell 8.94% (Kimberley Process 2025 summary) (Kimberley Process 2024 summary).
Other producers moved in the opposite direction. Angola’s volume rose 8.33%, from 14,027,002.73 to 15,195,293 carats. Canada’s volume rose 5.87%, from 13,321,628 to 14,103,511 carats (Kimberley Process 2025 summary) (Kimberley Process 2024 summary).
These calculations describe reported carat output. They do not, by themselves, establish why production changed or predict what any country will produce next.
Global rough trade contracted in both volume and value from 2024 to 2025. But trade flows still exceeded mine production because stones can cross borders multiple times between producer countries, trading hubs, and cutting centers. (Kimberley Process 2025 summary) (Kimberley Process 2024 summary)
Kimberley Process participants reported 263,649,744.14 carats of rough imports worth $25,604,406,826.99 in 2025. The average import value was $97.12 per carat (Kimberley Process 2025 summary). Compared with 2024, import volume fell 8.67%, and import value fell 17.51% (Kimberley Process 2025 summary) (Kimberley Process 2024 summary).
India was the largest reported destination, importing 106,099,294.44 carats worth $11,074,110,384.03. That equaled 40.24% of global import volume and 43.25% of value (Kimberley Process 2025 summary) (Kimberley Process 2025 charts). The United Arab Emirates imported 91,164,431.67 carats worth $7,155,820,916.22. The European Union imported 31,598,585.02 carats worth $3,532,810,674.63 (Kimberley Process 2025 summary).
Reported rough exports totaled 264,120,586.74 carats worth $25,279,356,441.29 in 2025, averaging $95.71 per carat (Kimberley Process 2025 summary). Export volume fell 7.18% from 2024, and export value fell 15.24% (Kimberley Process 2025 summary) (Kimberley Process 2024 summary).
The United Arab Emirates led export value at $9,283,275,787.81. The European Union reported $3,189,083,053.27. Botswana reported $3,116,243,015.59 (Kimberley Process 2025 summary). These flows show different roles in the pipeline. The UAE and EU operate as major trading hubs. Botswana remains a leading producer.
Participants issued 30,499 import certificates and 30,639 export certificates in 2025 (Kimberley Process 2025 summary). Each figure counts certificates issued, not stones, mines, businesses, or necessarily unique physical shipments.
The Kimberley Process data supports rough-diamond production and trade analysis within its reporting system. It does not support an inferred percentage for conflict diamonds, so this article does not provide one.
Industry statistics can describe certified rough-diamond flows, but they cannot show what one jewelry purchase supports after the stone enters retail. Do Amore pairs its jewelry with a documented clean water impact. Every purchase provides one person with clean water, and customers receive project updates with GPS coordinates for the well connected to their order. That record gives buyers a first-party way to check the impact claim.
No single polished-trade figure can stand in for total global diamond-industry revenue. Antwerp and India cover different places and reporting periods, and both sit downstream from mine production.
Adding these figures to global rough imports or exports would be misleading. The same material can appear at several points in the pipeline.
Antwerp’s combined imports and exports across rough and polished natural diamonds, synthetic diamonds, and industrial diamonds reached $19.07 billion in 2025. That was 22.4% below 2024 (AWDC).
Polished diamonds accounted for $12.5 billion, or 65.6%, of Antwerp’s total. Rough diamonds contributed $6.48 billion, or 34%. Synthetic diamonds accounted for 0.37%, and industrial diamonds represented 0.06% (AWDC). These are Antwerp-specific trade figures, not global industry totals.
India’s preliminary cut and polished diamond exports were $13,292.43 million in fiscal 2024-25. That was 16.75% below the $15,967.02 million recorded in fiscal 2023-24 (GJEPC annual report).
The United States accounted for 36.25% of India’s fiscal 2024-25 cut and polished diamond export value. Hong Kong represented 24.23%, and the UAE represented 14.11% (GJEPC annual report). These percentages describe destinations for India’s exports, not shares of all global polished-diamond demand.
Diamond price direction depends on the measure you mean. A simple up-or-down answer misses too much.
The global Kimberley Process average production value rose from $87.38 per carat in 2024 to $93.43 in 2025, a calculated increase of 6.92% (Kimberley Process 2025 summary) (Kimberley Process 2024 summary). At the same time, De Beers reported a lower realized price and a lower rough-price index. Neither series is a retail price index.
Average production value per carat divides reported production value by production volume. A larger share of higher-value stones can lift the average even as total volume and value fall.
That is what the 2025 global figures show. Production volume fell 23.47%, value fell 18.17%, and average value per carat rose 6.92% (Kimberley Process 2025 summary) (Kimberley Process 2024 summary). Treating that increase as a retail price rise would be inaccurate.
Use market statistics to set context, not to price one engagement-ring diamond. Do Amore’s natural diamond search lets you narrow stones by carat, cut, color, clarity, certification, and price, so the comparison stays at the stone level instead of treating a global average as a quote. Match the grading details, then compare appearance and price side by side.
De Beers reported 2025 group revenue of $3.493 billion, usually rounded to $3.5 billion, including $3.0 billion in rough-diamond sales. Consolidated sales volume was 20.946 million carats, and production was 21.656 million carats (De Beers 2025 results).
Its full-year average realized price fell 7%, from $152 to $142 per carat. Its average rough-price index declined 12%. The company reported an underlying EBITDA loss of $511 million (De Beers 2025 results). These are De Beers results, not estimates for the entire industry.
For H1 2026, De Beers reported $1.583 billion in revenue, $1.3 billion in rough sales, and 12.446 million carats of consolidated sales. Its average realized price was $105 per carat, down 32% from $155, and its rough-price index fell 16% (De Beers interim results). Again, these are six-month company results, not full-year global statistics.
The clearest natural diamond supply signal is contraction in reported global mine output. At the same time, country results moved in different directions, and trade value fell faster than trade volume. That makes broad claims like “diamond supply rose” or “diamond prices fell” too imprecise to be useful.
Reported global production fell from 129.12 million carats in 2024 to 98.82 million in 2025 (Kimberley Process 2025 summary) (Kimberley Process 2024 summary). Russia, Botswana, and the Democratic Republic of the Congo recorded lower production volume. Angola and Canada recorded increases.
Volume leadership and value leadership are not identical. Botswana represented 15.68% of global production volume but 21.43% of value. Namibia did not rank among the five largest producers by carats, yet its average production value was $343.88 per carat (Kimberley Process 2025 summary) (Kimberley Process 2025 charts).
India’s 40.24% share of rough-import volume reflects its cutting and polishing role. The UAE’s $9.28 billion in rough-export value and Antwerp’s $19.07 billion in combined diamond trade show different hub functions (Kimberley Process 2025 summary) (Kimberley Process 2025 charts) (AWDC).
A current company signal adds another layer. De Beers’ H1 2026 production rose 46% to 14.914 million carats. Its average realized price fell 32% to $105 per carat. Consolidated sales volume rose 13% to 12.446 million carats (De Beers interim results). Those results show why output, sales, and price need separate labels.
Lumping natural, lab-grown, and industrial diamonds into one production total would blur three very different datasets. They may share a crystal structure, but their reporting systems, uses, and market stages differ.
Kimberley Process production statistics cover mined natural rough diamonds. Gem-quality lab-grown diamonds are manufactured and disclosed through a different system, so KP carat totals do not describe the lab-grown jewelry market.
Both natural and lab-grown diamonds are real diamonds. Buyers get more value from comparing origin, price, and personal priorities than from debating whether one category “counts.” Do Amore offers separate searches for lab-grown diamonds and natural stones so those choices remain clear rather than blended.
Industrial diamond data describes abrasives, tools, and other technical uses, not engagement-ring gems. The U.S. Geological Survey estimated 2025 U.S. manufactured industrial-diamond output at 160 million carats worth $52 million (USGS Industrial Diamond).
The United States recorded 170 million carats of industrial-diamond imports, 72 million carats of exports, and 270 million carats of apparent consumption in 2025. Recycled material included 15 million carats of powder and 75,000 carats of stone (USGS Industrial Diamond).
Worldwide manufactured industrial-diamond production exceeded 15 billion carats. Synthetic diamond accounted for more than 99% of global industrial-diamond production and consumption (USGS Industrial Diamond). Those enormous volumes should never be used as a proxy for gem-quality lab-grown diamond jewelry.
Upstream averages offer market context, but they cannot quote the price of a finished stone. A global production value of $93.43 per carat does not tell you what a finished diamond will cost. Cutting yield, the 4Cs, grading, wholesale and retail costs, setting choices, and the characteristics of one stone all matter. (Kimberley Process 2025 summary)
If you are comparing natural diamonds, focus on a specific stone’s grading report, cut, color, clarity, carat weight, and appearance. A market average cannot replace that side-by-side evaluation.
The same principle applies to lab-grown options. Compare like with like, keep origin clearly labeled, and use Do Amore’s diamond education guides when a term or trade-off is unfamiliar. You should finish the comparison feeling informed and unhurried.
This article prioritizes original data over estimates repeated by secondary publications. Kimberley Process documents supply the global rough-production and trade baseline. AWDC and GJEPC provide bounded trade views for Antwerp and India. USGS supplies industrial-diamond data, and De Beers results are used only as company-level benchmarks.
Each citation number belongs to one source and is reused when that source supports another claim. The linked markers in the article take you to the exact report or page. The plain-text URLs in the Sources list are retained for publication and audit purposes.
We used official datasets whenever a government, standards body, or industry reporting organization published the underlying figures. Company results appear only when the company is the original source for its own revenue, production, sales, or pricing measures.
No secondary aggregation was used to support a numerical claim. Named retail competitors were excluded from the evidence set, and no competitor domain is linked in the publishable article.
Year-over-year changes are calculated from the unrounded source values wherever those inputs are available. The formula is (new value minus old value) divided by the old value, multiplied by 100. Results are rounded to two decimal places.
Reader-friendly totals may be rounded in explanatory prose, but the exact figures remain in the article or the source record. For example, the text may say 98.8 million carats after first giving the exact total of 98,824,642.80 carats (Kimberley Process 2025 summary). This prevents a rounded headline from becoming a new, unsupported data point.
The available sources do not support one clean number for total global diamond-industry revenue. Production value, rough imports, rough exports, polished exports, hub trade, company revenue, and retail sales measure different things. This article reports them separately.
The datasets use different periods. Kimberley Process figures are calendar-year totals, India’s series uses fiscal years, and the 2026 company update covers six months. A higher value in one series cannot automatically explain a move in another, and correlation should not be presented as causation.
These common questions need scope-specific answers. Each response identifies the reporting year, population, and measure.
Kimberley Process participants reported 98,824,642.80 carats of natural rough-diamond production in 2025, or about 98.8 million carats (Kimberley Process 2025 summary). The total excludes polished stones, lab-grown gems, and retail jewelry. It is the latest complete official annual figure available for this 2026 publication.
By reported carat volume, the five largest producers were Russia at 31.89%, Botswana at 15.68%, Angola at 15.38%, Canada at 14.27%, and the Democratic Republic of the Congo at 9.02% (Kimberley Process 2025 charts). Rankings by value differ because average production value per carat varies among countries.
Different measures moved in different directions. The global average reported production value per carat rose 6.92% from 2024 to 2025 (Kimberley Process 2025 summary) (Kimberley Process 2024 summary). De Beers’ 2025 average realized price fell 7%, and its average rough-price index fell 12% (De Beers 2025 results). None of these figures is a universal retail-price measure.
The most useful diamond statistics are the ones with their boundaries intact. Keep natural separate from lab-grown, rough separate from polished, carats separate from dollars, and global totals separate from company results. Together, the numbers form a coherent picture. Reported 2025 mine output contracted, rough-trade value declined, and price signals differed by measure.
When you’re ready to apply that context to your own search, explore Do Amore’s engagement ring settings and compare stones with help from a gemologist. A clear, side-by-side comparison is the right next step.
Start with the setting, shortlist a few stones, and ask a gemologist to compare the details that market averages cannot show.